Last Updated on February 10, 2025 by Arif Chowdhury
Ever stared at a chart, feeling lost about which way the market is heading?
You’re not alone.
Navigating the Forex market can feel like riding a roller coaster.
And that’s where the Directional Movement Index (DMI) comes in.
It’s a powerful tool that can help you gauge market trends and improve your trading decisions.
So, let’s dive into what the DMI is and how to use it effectively.
Understanding the DMI
The DMI was developed by J. Welles Wilder Jr. back in the late ‘70s.
Its main purpose? To identify whether a market is trending and, if so, the strength of that trend.
Here’s the lowdown:
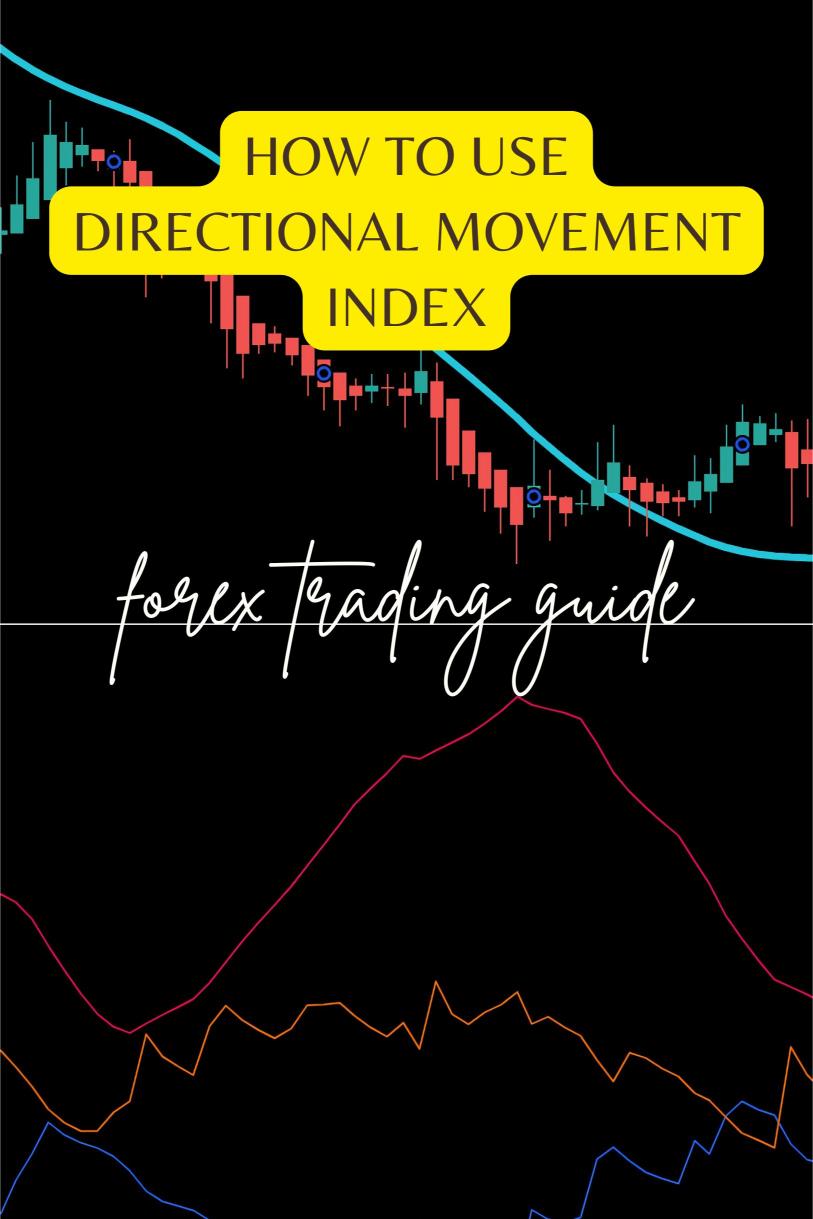
- Components: The DMI consists of two lines: the +DI (Positive Directional Indicator) and the -DI (Negative Directional Indicator).
- Average True Range (ATR): This is a volatility measure, helping you assess how much the market is moving.
When the +DI is above the -DI, it indicates an upward trend.
When the -DI is above the +DI, it signals a downward trend.
Why Use the DMI?
1. Trend Identification: The DMI helps you quickly identify whether the market is in a trend or moving sideways.
2. Strength Measurement: It measures the strength of the trend, giving you an edge in deciding when to enter or exit a trade.
3. Risk Management: By understanding the trend dynamics, you can better manage your risk and position size.
Did you know that according to statistical data, over 70% of traders fail due to poor trend analysis?
Using the DMI can significantly enhance your chances of being in the right trades.
How to Use the DMI
Let’s break it down into actionable steps.
- Set Up Your Chart:
- Use a trading platform like MetaTrader.
- Add the DMI indicator to your chart.
- Analyze the Lines:
- Look for crossovers. When the +DI crosses above the -DI, consider going long.
- Conversely, when the -DI crosses above the +DI, think about going short.
- Strength Confirmation:
- Check the ADX (Average Directional Index) line, which typically runs alongside the +DI and -DI.
- An ADX above 20 suggests a strong trend, while below 20 indicates a weak trend.
- Combine with Other Indicators:
- Use the DMI alongside other tools like moving averages or RSI for better confirmation of your trades.
Tips for Using the DMI
- Don’t Rely Solely on DMI:
- It’s crucial to use it as part of a broader strategy.
- Many successful traders blend multiple indicators.
- Watch for False Signals:
- In choppy markets, the DMI can produce misleading signals.
- Be cautious during such times.
- Practice Risk Management:
- Always set stop-loss orders to protect your capital.
- The DMI can help you identify good entry points, but the market can still be unpredictable.
Boost Your Trading Edge
As a seasoned Forex trader since 2015, I’ve developed a unique trading strategy that leverages both fundamental and technical analysis.
I’ve created a portfolio of 16 sophisticated trading bots specifically designed for major currency pairs like EUR/USD, GBP/USD, USD/CHF, and USD/JPY.
These bots are diversified to minimize correlated losses, enhancing overall profitability.
And here’s the kicker: I’m offering this entire EA portfolio for FREE!
You can get started by checking out the best Forex brokers I’ve tested.
Once you open an account and deposit a minimum of $500, you’ll gain access to my bots, which have been backtested for over 20 years.
They perform excellently, even under harsh market conditions.
Conclusion
The DMI is a fantastic tool for traders looking to improve their market analysis and trading performance.
By understanding its components and how to use it effectively, you can enhance your decision-making process.
Remember, trading is a journey, and having the right tools can make all the difference.
Don’t miss out on the chance to elevate your trading game.
Check out my trading bots portfolio to start trading with a proven strategy today!