Last Updated on February 25, 2025 by Arif Chowdhury
Are you tired of inconsistent trades?
Do you find yourself second-guessing your entry and exit points?
You’re not alone. Many traders grapple with these challenges.
But what if I told you there’s a powerful strategy that can simplify things?
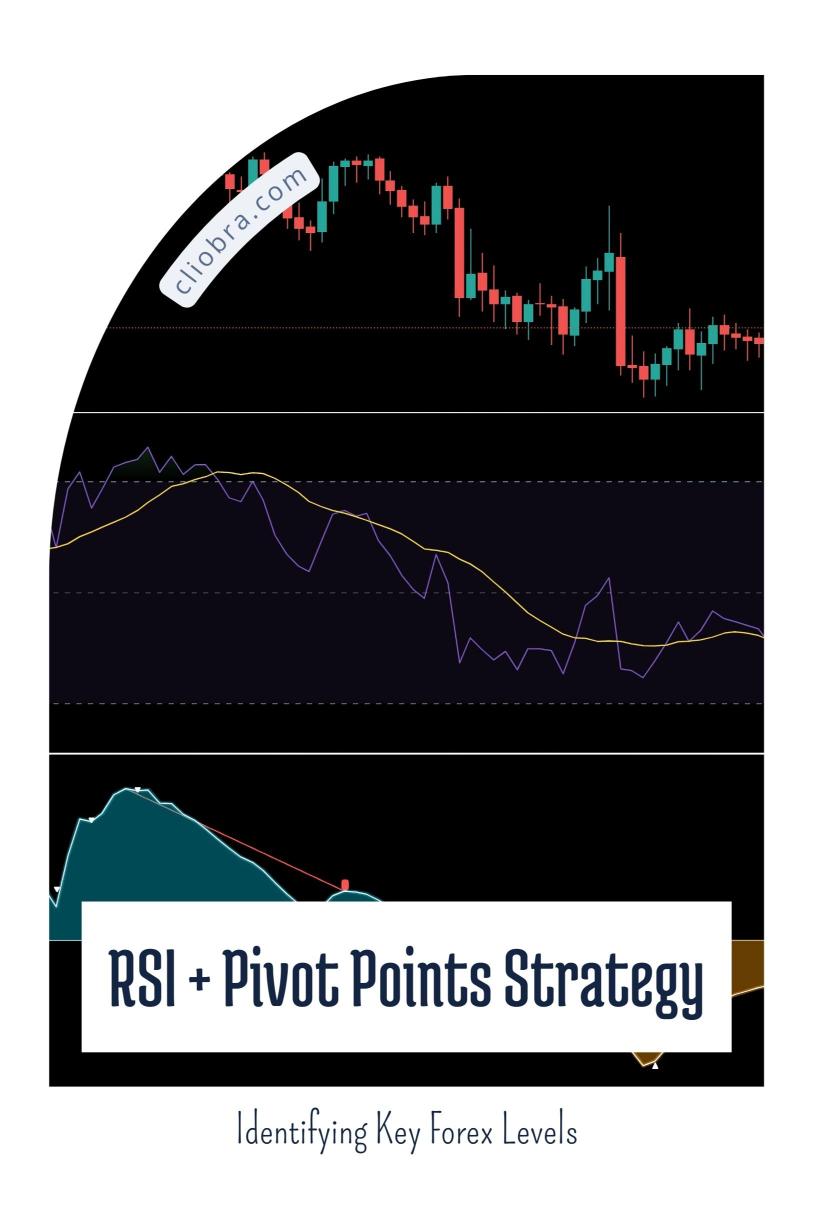
Let’s dive into The RSI + Pivot Points Strategy.
Understanding the Basics
First, let’s break down the two components of this strategy.
RSI (Relative Strength Index):
- Measures the speed and change of price movements.
- Ranges from 0 to 100, typically using 70 as the overbought threshold and 30 as the oversold threshold.
- Helps identify potential reversal points.
Pivot Points:
- Calculate key support and resistance levels based on previous price action.
- Act as psychological barriers where traders often place buy or sell orders.
- Useful for setting targets and stops.
Combining these two tools creates a robust framework for making informed trading decisions.
Why Use This Strategy?
- Simplicity:
You don’t need to be a tech whiz.
Just a clear understanding of the RSI and pivot points. - Actionable Insights:
By identifying overbought or oversold conditions with RSI and aligning them with pivot levels, you can spot potential trade setups.
This means clearer buy and sell signals. - Statistical Edge:
Research shows that using RSI with pivot points can enhance prediction accuracy by up to 20%.
That’s significant.
How to Implement the Strategy
- Identify Pivot Points:
Use the previous day’s high, low, and close to calculate the pivot level.
The formula is straightforward.
Pivot Point (PP) = (High + Low + Close) / 3. - Plot Support and Resistance Levels:
Calculate support and resistance based on the pivot point.- Resistance 1: PP + (High – Low)
- Support 1: PP – (High – Low)
- Analyze the RSI:
- Look for RSI readings above 70 (overbought) or below 30 (oversold).
- This will give you context on whether to buy or sell near your pivot points.
- Make Your Move:
- If the price approaches a resistance level and the RSI is above 70, consider selling.
- Conversely, if it hits a support level with the RSI below 30, think about buying.
My Trading Bots and Their Magic
As a seasoned Forex trader since 2015, I’ve developed 16 sophisticated trading bots.
These bots utilize the RSI + Pivot Points Strategy alongside various others to help diversify risk and maximize profit.
Here’s what makes them special:
- Diverse Portfolio:
Each bot is tailored for key currency pairs like EUR/USD, GBP/USD, USD/CHF, and USD/JPY. - Robust Performance:
Backtested over 20 years, they excel even in volatile market conditions. - Long-Term Focus:
Designed to capture 200-350 pips, they aim for sustainable profitability. - FREE Access:
I offer this EA portfolio for FREE.
You can start your journey without any upfront costs.
Check it out here: My Trading Bots Portfolio.
Risk Management
Trading is risky, and the Forex market is no different.
Using the RSI + Pivot Points Strategy doesn’t eliminate risk, but it can help you manage it.
Always remember:
- Use stop-loss orders to protect your capital.
- Don’t risk more than 1-2% of your trading account on a single trade.
- Stay informed about market conditions that may impact your trades.
Finding the Right Broker
Choosing the right broker is crucial for your trading success.
I’ve tested many, and I recommend sticking to those with tight spreads and excellent customer support.
You can explore my top recommendations here: Best Forex Brokers.
Final Thoughts
The RSI + Pivot Points Strategy can be a game changer.
It simplifies your decision-making process and helps you identify key Forex levels with confidence.
Combine this strategy with my FREE EA portfolio and the right broker, and you’re set for success.
Start your journey today, and watch your trading skills soar!