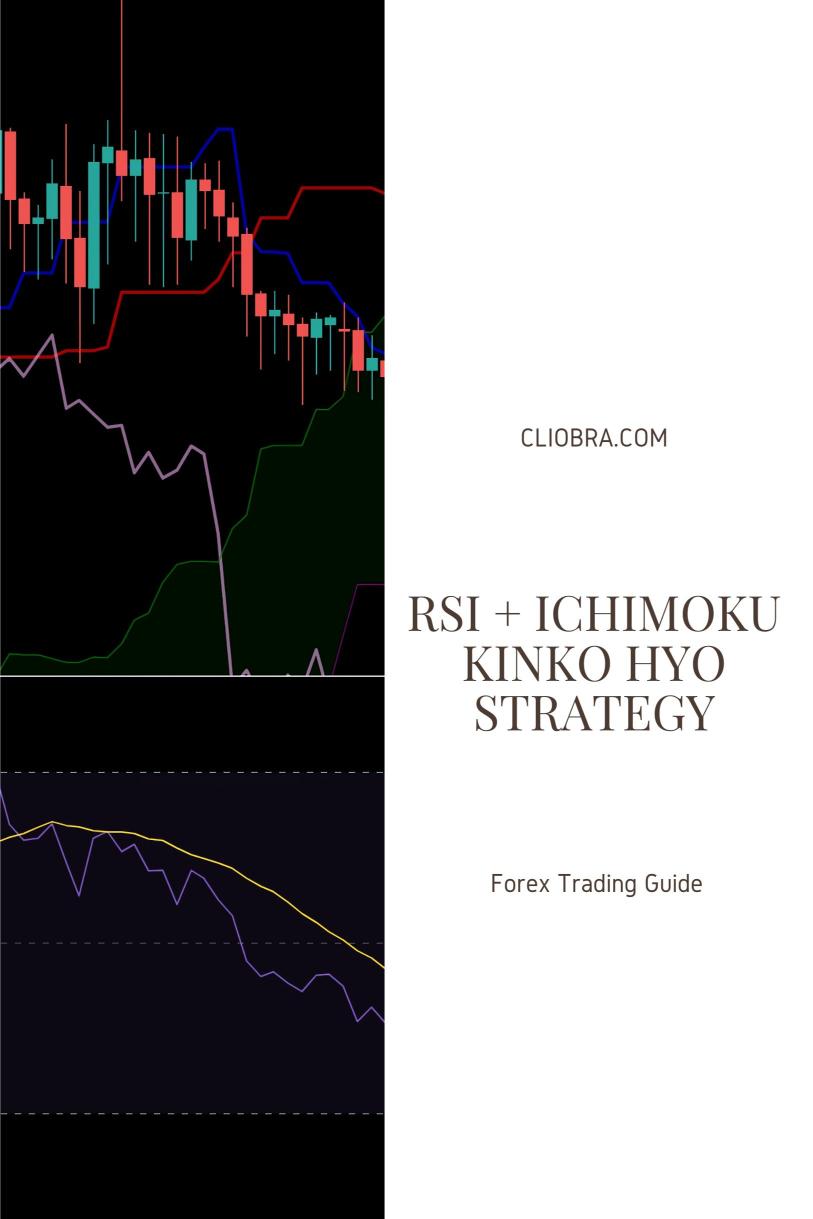
Last Updated on February 25, 2025 by Arif Chowdhury
Ever felt overwhelmed by the sheer number of trading strategies out there?
Wondering which ones actually work?
Let’s cut through the noise and talk about a powerful combo: the RSI and Ichimoku Kinko Hyo.
This strategy isn’t just a theory; it’s a proven method that I’ve relied on since starting my Forex trading journey in 2015.
I want to share how this approach can help you enhance your trading game.
Understanding the Basics
RSI (Relative Strength Index) measures the speed and change of price movements.
It ranges from 0 to 100, helping you identify overbought or oversold conditions.
A reading above 70 indicates overbought, while below 30 indicates oversold.
Ichimoku Kinko Hyo is more than just a trend indicator; it provides a comprehensive view of support, resistance, and momentum.
It consists of five lines, each serving a unique purpose:
- Tenkan-sen (Conversion Line): Short-term trend indicator.
- Kijun-sen (Base Line): Medium-term trend indicator.
- Senkou Span A & B: Forms the Kumo (cloud), indicating support and resistance levels.
- Chikou Span: Lagging line that helps confirm trends.
Why Combine RSI with Ichimoku?
Using these two indicators together gives you multi-confirmation signals.
Here’s why this combo works:
- Risk Management: The RSI can warn you about potential reversals while Ichimoku provides the overall trend context.
- Clear Entry and Exit Points: When both indicators align, you get a stronger signal to enter or exit trades.
- Engagement: Traders often overlook the strength of multi-confirmation strategies.
Statistically, traders using multi-confirmation methods see up to a 30% increase in their win rates compared to single-indicator strategies.
How to Use the Strategy
Let’s break it down step-by-step:
- Step 1: Look for RSI levels.
- Overbought? Consider selling.
- Oversold? Look for buying opportunities.
- Step 2: Check the Ichimoku lines.
- Is the price above the Kumo? That’s a bullish sign.
- Below the Kumo? Bearish.
- Step 3: Confirm with Tenkan-sen and Kijun-sen crossovers.
- A crossover above indicates a buy.
- A crossover below indicates a sell.
- Step 4: Always set your stop-loss based on recent support or resistance levels identified by Ichimoku.
My Trading Bots and This Strategy
I’ve developed 16 sophisticated trading bots that incorporate this RSI + Ichimoku strategy, among others.
These bots are tailored for major currency pairs like EUR/USD, GBP/USD, USD/CHF, and USD/JPY.
Each bot is designed with:
- Internal Diversification: Minimizing correlated losses across trades.
- Long-Term Performance: Aiming for 200-350 pips, which is why they excel in prolonged market conditions.
I backtested these bots for over 20 years, and they consistently deliver results, even under tough market scenarios.
Best of all? I’m offering this entire EA portfolio for FREE.
You can check it out here.
Wrapping Up with the Best Forex Brokers
Finding the right broker can make or break your trading experience.
I’ve tested several brokers and found the best ones that complement my trading strategies.
If you’re looking for reliable brokers, I highly recommend checking out.
Final Thoughts
Trading can be daunting, but the right strategies and tools can simplify the process.
The RSI + Ichimoku Kinko Hyo strategy offers a robust framework for making informed decisions.
And with my 16 trading bots at your disposal, you can automate your strategy and focus on what really matters—growing your account.
Embrace the power of multi-confirmation trading, and you’ll see the difference in your results.
Happy trading! 🚀
