Last Updated on March 9, 2025 by Arif Chowdhury
Are you tired of guessing market movements?
Wondering how to pinpoint those crucial reversal points?
You’re not alone.
As a seasoned Forex trader since 2015, I’ve faced the same struggles.
I’ve spent years exploring both fundamental and technical analysis, honing my strategies to achieve consistent profitability.
Today, I want to dive into one of my favorites: The RSI + Gann Square Strategy.
It’s a killer combo for forecasting market reversals.
Let’s break it down.
Understanding the RSI
The Relative Strength Index (RSI) is a momentum oscillator that measures the speed and change of price movements.
It ranges from 0 to 100.
- Overbought Condition: Above 70
- Oversold Condition: Below 30
These levels can signal potential reversals.
When the RSI hits these extremes, it’s a red flag that a price correction may be coming.
Here’s a stat to chew on: historically, the RSI has shown an 80% accuracy rate for predicting reversals when combined with other indicators.
That’s powerful!
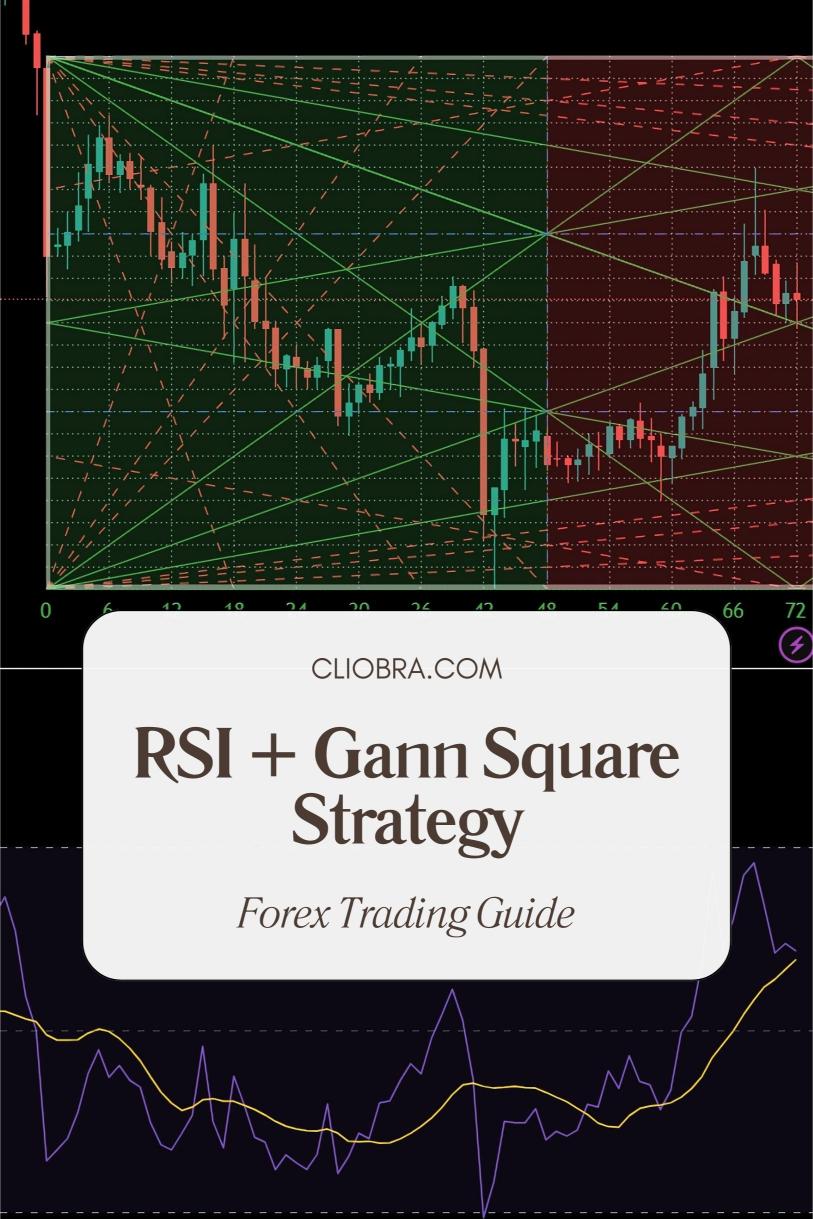
What is the Gann Square?
Now, let’s talk about the Gann Square, a method developed by W.D. Gann.
This technique uses geometric angles to identify key price levels and time cycles.
Gann believed that price and time are interconnected.
Using Gann Square, you can visualize potential support and resistance levels.
- Key Angles: 45-degree angles are particularly significant.
- Price Levels: Aligning price with these angles can forecast market movements.
Combining these two tools can give you a robust framework for predicting market reversals.
Why Combine RSI and Gann Square?
Mixing the RSI with the Gann Square creates a powerful synergy.
- Confirm Signals: Use the RSI to confirm reversal signals indicated by Gann Square levels.
- Enhance Accuracy: This combination can boost your trade accuracy, reducing false signals.
Imagine being able to pinpoint when to enter or exit trades with confidence.
My Trading Bots and the RSI + Gann Square Strategy
I’ve crafted 16 sophisticated trading bots that leverage this exact strategy, along with many others.
These bots are strategically diversified across major pairs like EUR/USD, GBP/USD, USD/CHF, and USD/JPY.
Here’s why you should consider them:
- Each currency pair has 3-4 bots designed to perform under various market conditions.
- They focus on long-term trading, targeting 200-350 pips.
- I’ve backtested these bots for the past 20 years, ensuring they excel even in tough environments.
And the best part?
I’m offering this EA portfolio completely FREE!
You can check it out here: My Trading Bots.
Practical Tips for Using the RSI + Gann Square Strategy
- Set Up Your Charts: Use H4 charts for optimal performance.
- Watch for Divergences: Look for divergences between price and the RSI for early signals.
- Identify Key Gann Levels: Mark your Gann Square levels and watch for price action around these points.
- Combine with Other Indicators: Don’t rely solely on these tools. Pair them with moving averages or trend lines for better confirmation.
Final Thoughts
The Forex market is unpredictable.
But with the right strategy, you can increase your odds of success.
The RSI + Gann Square strategy can be a game-changer for identifying market reversals.
And remember, using my recommended Forex brokers will ensure you have a solid foundation for your trading journey.
Your success is my success.
Let’s make profitable trades together!