Last Updated on March 2, 2025 by Arif Chowdhury
Are you tired of second-guessing market moves?
Wondering how to effectively gauge trend strength without getting lost in the noise?
Let’s break it down.
As a seasoned Forex trader since 2015, I’ve navigated the ups and downs of the market. My journey led me to develop a unique trading strategy that incorporates the Relative Strength Index (RSI) and the Accumulative Swing Index (ASI). Together, they form a powerful duo for spotting trend strength.
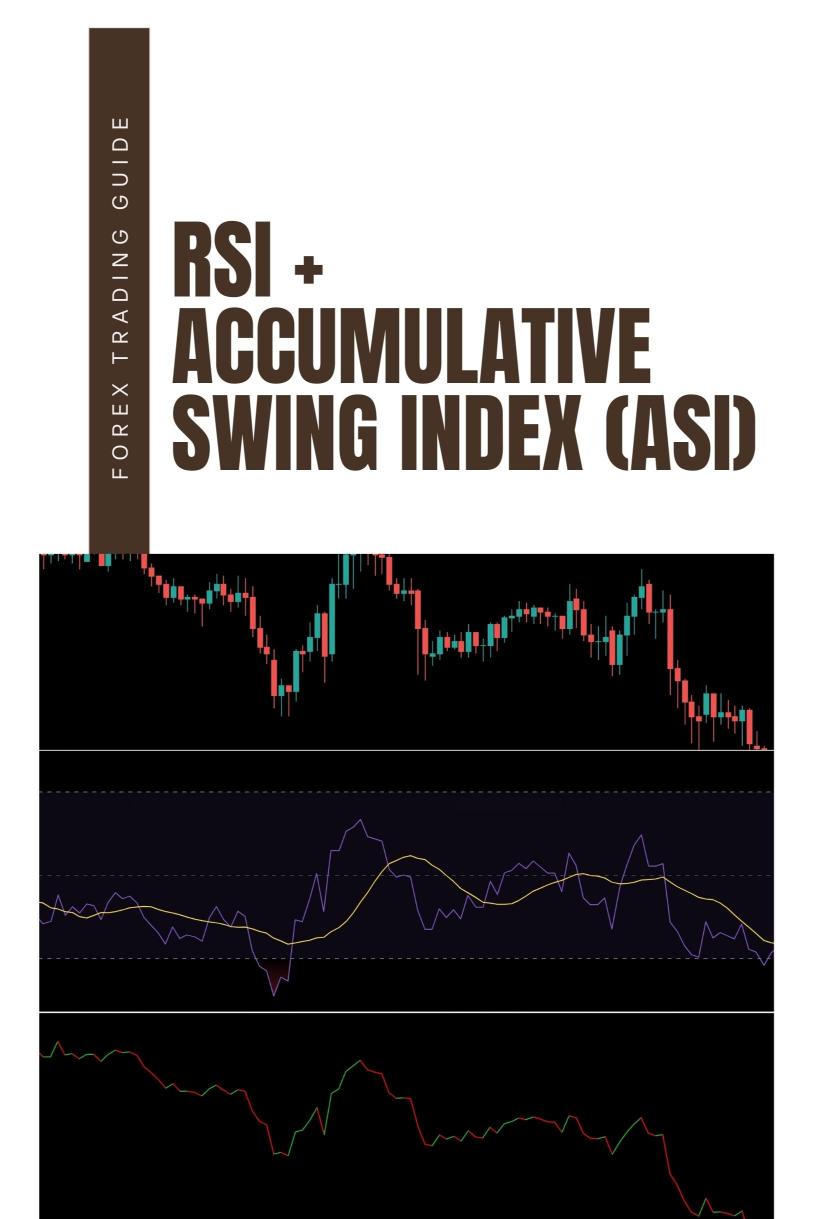
What is the RSI?
The RSI is a momentum oscillator that measures the speed and change of price movements.
It ranges from 0 to 100 and helps identify overbought or oversold conditions.
Here’s how it works:
- Above 70: Overbought territory (potential price drop)
- Below 30: Oversold territory (potential price rise)
But it’s not just about the numbers. The RSI helps you see when the market is getting too hot or too cold.
What is the ASI?
The Accumulative Swing Index (ASI) gives you insight into the strength of price movements.
It’s calculated using price swings and volume, helping you understand market trends better.
Here’s what the ASI tells you:
- Positive ASI: Bullish trend strength
- Negative ASI: Bearish trend strength
Combining these two indicators can enhance your trading decisions significantly.
Why Combine RSI and ASI?
Using RSI and ASI together provides a clearer picture of market dynamics.
- The RSI tells you about momentum.
- The ASI shows you trend strength.
When both indicators align, it’s a strong signal.
Imagine you see an RSI above 70 along with a declining ASI.
That’s a red flag!
Conversely, if the RSI is below 30 while the ASI is climbing, that’s a green light for potential buying.
How to Implement the Strategy
Here’s how you can effectively use the RSI + ASI strategy:
- Set your RSI: Use the standard 14-period setting.
- Monitor ASI: Keep an eye on the ASI for trend confirmation.
- Look for divergence: If RSI indicates an overbought condition while ASI is trending down, it’s time to reassess your position.
These steps can make your trading more systematic and less emotional.
My Trading Portfolio
Now, let’s talk about my 16 sophisticated trading bots.
These bots are designed to exploit strategies like the RSI + ASI, among many others.
Each bot is tailored for major currency pairs—EUR/USD, GBP/USD, USD/CHF, and USD/JPY.
What sets my portfolio apart?
- Internal Diversification: Each currency pair has 3-4 bots, reducing correlated losses.
- Long-Term Focus: Designed for trades of 200-350 pips, these bots perform better over time.
- Backtested Success: They’ve been tested over 20 years and thrive under tough conditions.
And here’s the best part: I’m offering this EA portfolio for completely FREE!
If you want to elevate your trading game, check my trading bots.
Making the Most of Your Trading
Remember, the market is unpredictable.
Using the RSI + ASI strategy can help you make informed decisions, but it’s essential to manage your risk.
When choosing a broker, look for tight spreads, quick execution, and solid customer support.
I’ve tested numerous brokers, and I recommend you to check out the best options.
Final Thoughts
The RSI + ASI strategy is a powerful tool in any trader’s toolkit.
With thoughtful implementation, it can significantly improve your trading results.
Combine this strategy with my 16 trading bots, and you’ll have a robust system that enhances profitability while minimizing risk.
Don’t forget to explore the best forex brokers to ensure you have a solid foundation for your trading journey.