Last Updated on April 5, 2025 by Arif Chowdhury
Ever felt stuck trying to decide when to jump into a trade?
Or worried about missing the right moment because of conflicting signals?
As a seasoned Forex trader since 2015, I’ve been there.
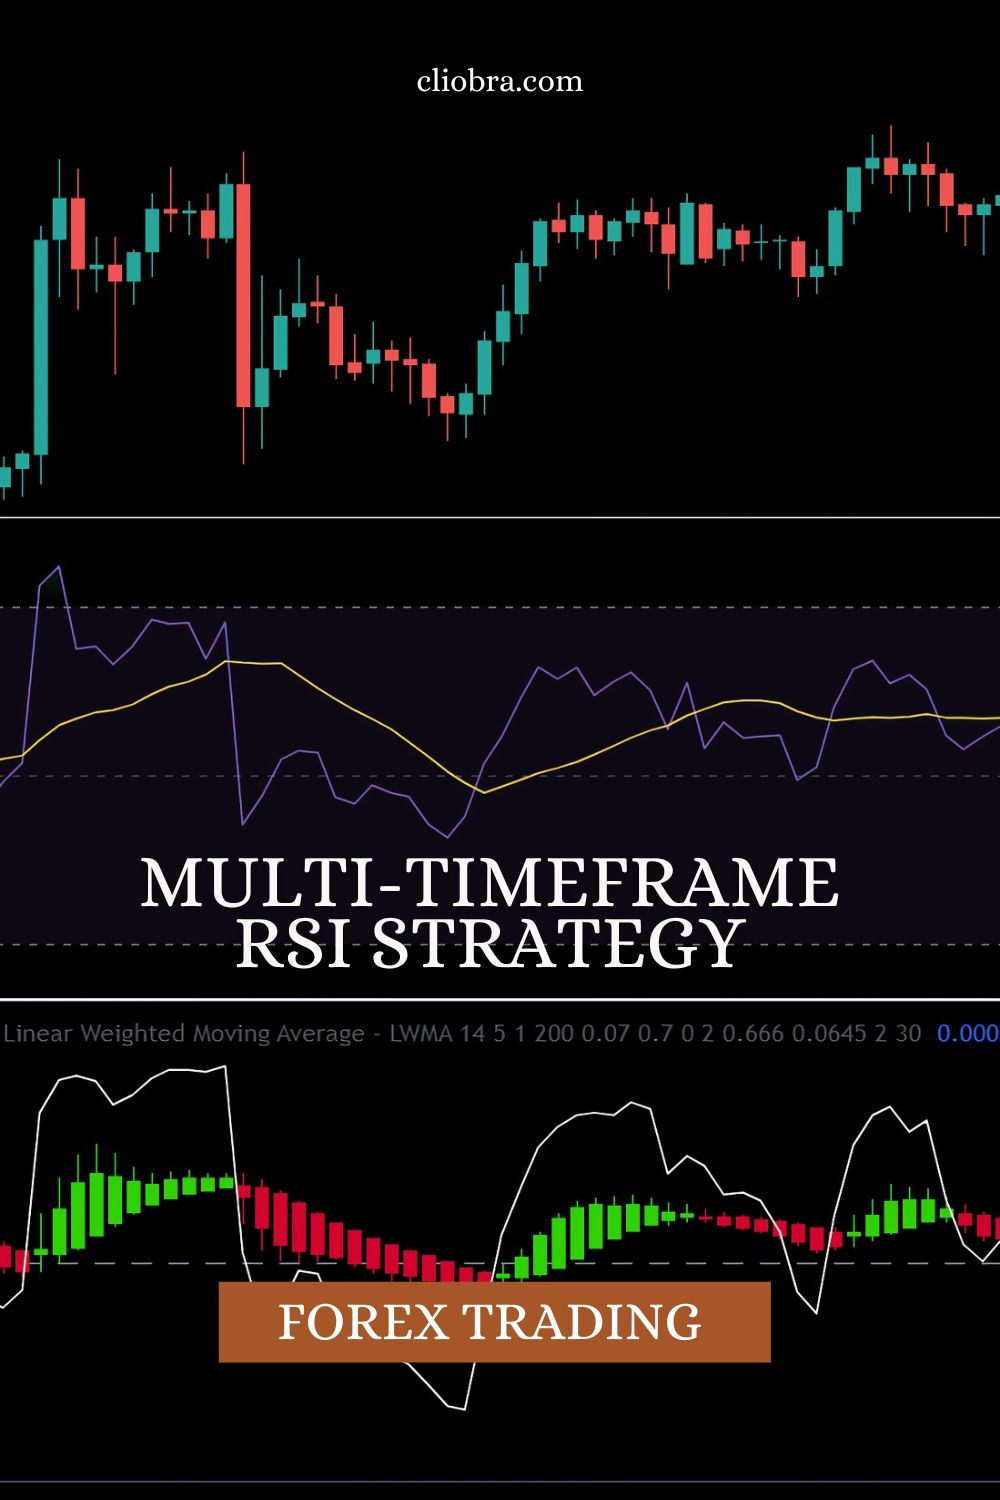
I’ve sifted through countless strategies, but one that stands out is the Multi-Timeframe RSI Strategy.
It’s straightforward, powerful, and, best of all, it helps confirm your trade entries with confidence.
Let’s break this down.
What is the Multi-Timeframe RSI Strategy?
The Relative Strength Index (RSI) is a popular momentum oscillator that measures the speed and change of price movements.
When combined with multiple timeframes, it becomes a robust tool for confirming trade entries.
The beauty of this strategy lies in its simplicity.
Here’s how it works:
- Use the RSI on three different timeframes: a higher timeframe (like H4), your trading timeframe (like H1), and a lower timeframe (like M15).
- Look for divergence and overbought/oversold conditions across these timeframes.
- Confirm your entry when all timeframes align.
This approach minimizes the noise you often see in trading.
Why Multi-Timeframe Analysis?
Multi-timeframe analysis helps you get a broader view of the market.
You’re not just looking at one snapshot; you’re seeing the bigger picture.
- A higher timeframe shows the overall trend.
- Your trading timeframe gives you more precise entry points.
- A lower timeframe helps you fine-tune your exits.
Statistically, traders who use multi-timeframe analysis improve their win rates by up to 20%.
That’s not just a number—it’s a game-changer.
How to Implement the Multi-Timeframe RSI Strategy
Ready to get started?
Here’s a quick guide:
- Set Up Your Charts
- Choose your three timeframes: H4, H1, and M15.
- Apply the RSI indicator to each.
- Identify the Trend
- On the H4 chart, look for the general trend direction.
- If the RSI is above 70, the market is overbought. Below 30, it’s oversold.
- Check the Trading Timeframe
- On the H1 chart, look for potential entry signals.
- Confirm overbought/oversold conditions and any divergences.
- Fine-Tune on the Lower Timeframe
- On the M15 chart, wait for a clear signal to enter.
- Look for candlestick patterns or other confirming indicators.
- Manage Your Trade
- Set stop-loss orders to protect your capital.
- Use take-profit levels based on previous support/resistance or a risk/reward ratio.
The Golden Grid EA: Your Trading Ally
While the Multi-Timeframe RSI Strategy is powerful, you might be wondering how to automate these insights.
That’s where my Golden Grid EA comes in.
This exceptional trading bot captures volatility across all currency pairs, and it shines on Gold (XAU/USD).
Here’s what makes it a game-changer:
- Immediate Action: It starts trading instantly without waiting for signals.
- Quick Gains: Typically captures 20-40 short pips, aiming for 2-3% ROI within hours.
- Risk Management: Always test in a demo account first to understand its dynamics.
With my Golden Grid EA, you get the best of both worlds—automation and strategy.
Why You Should Use Trusted Forex Brokers
Now that you have a solid strategy and a powerful EA, let’s talk about execution.
Choosing the right broker is crucial.
I’ve tested some of the best, and here’s why they stand out:
- Tight Spreads: Lower costs mean higher profit margins.
- Fast Execution: Speed matters in Forex. Instant execution can save you from slippage.
- Outstanding Support: When you have questions, you want quick answers.
Check out my recommendations for the best Forex brokers that can enhance your trading experience.
Conclusion
The Multi-Timeframe RSI Strategy is an excellent tool for confirming trade entries.
By coupling it with my Golden Grid EA, you can automate your trading while maintaining your strategy’s integrity.
Remember, Forex trading comes with risks, but with the right tools and strategies, you can navigate the markets effectively.
Stay informed, trade smart, and don’t hesitate to leverage the best brokers to maximize your success.
