Last Updated on February 22, 2025 by Arif Chowdhury
Hey there, fellow traders!
Ever find yourself staring at charts, wondering if you’re making the right moves?
Or maybe you’ve been burned by volatile markets and are searching for a reliable strategy?
I get it.
As a seasoned Forex trader since 2015, I’ve been through the ups and downs of trading, and I’ve honed my skills through a blend of fundamental and technical analysis.
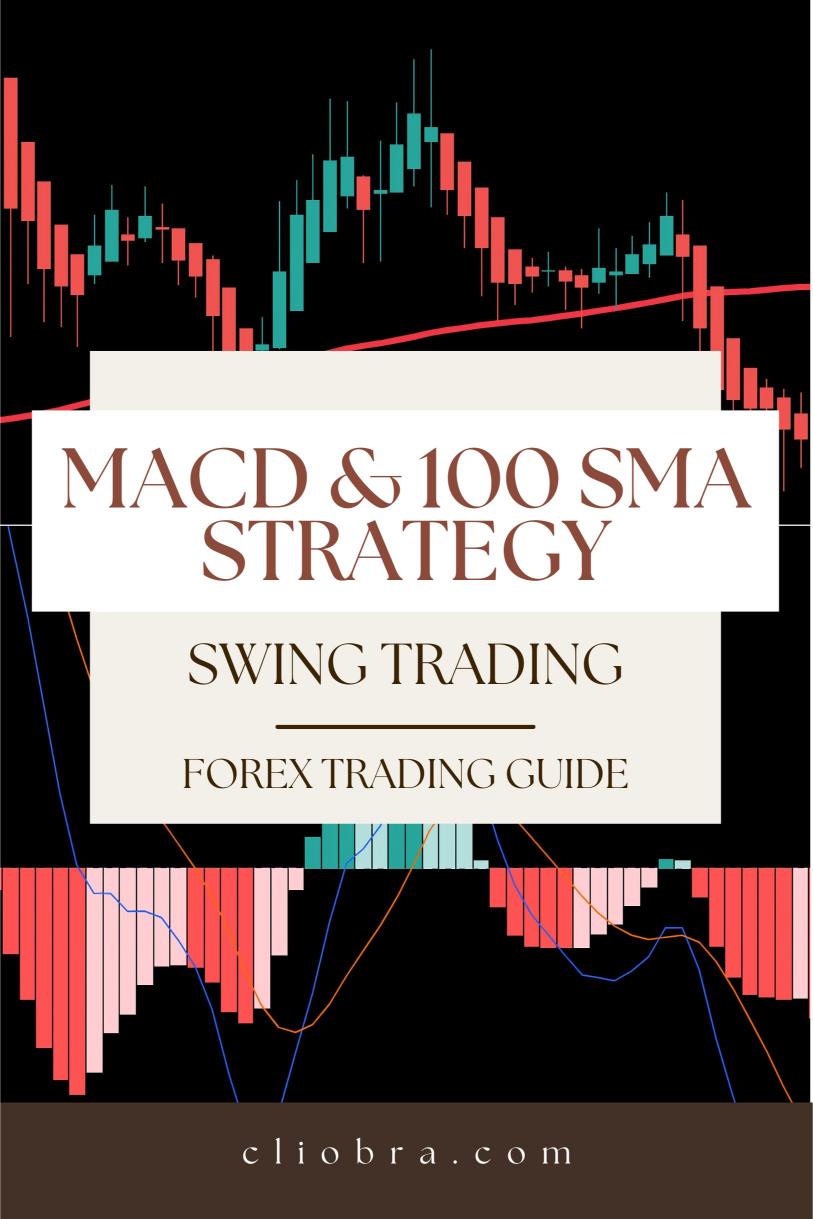
Today, I want to share a straightforward yet powerful strategy that’s been a game-changer for me: The MACD & 100 SMA Strategy.
Let’s dive right in!
What is the MACD?
The Moving Average Convergence Divergence (MACD) is a momentum indicator that shows the relationship between two moving averages of a security’s price.
It’s composed of three main components:
- MACD Line: The difference between the 12-day and 26-day exponential moving averages (EMAs).
- Signal Line: A 9-day EMA of the MACD line.
- Histogram: The difference between the MACD line and the signal line.
When the MACD crosses above the signal line, it’s a potential buy signal. When it crosses below, it’s a potential sell signal.
What is the 100 SMA?
The 100 Simple Moving Average (SMA) is just that—a simple average of the closing prices over the last 100 periods.
It smooths out price data and helps identify the overall trend.
Here’s why it matters:
- Trend Indicator: If the price is above the 100 SMA, it indicates an uptrend; below means a downtrend.
- Support and Resistance: The 100 SMA can act as a dynamic level of support or resistance.
How to Combine Both for Swing Trading
Now, let’s put these two indicators together for a robust trading strategy.
Here’s how it works:
- Identify the Trend: Use the 100 SMA to determine the overall trend.
- Above the 100 SMA: Look for buy signals.
- Below the 100 SMA: Look for sell signals.
- Look for MACD Crosses:
- When the MACD line crosses above the signal line while the price is above the 100 SMA, it’s a buy signal.
- When the MACD line crosses below the signal line while the price is below the 100 SMA, it’s a sell signal.
- Confirmation: Always look for additional confirmation through other indicators or price action.
Why This Strategy Works
Statistically, strategies that combine multiple indicators tend to perform better.
In fact, studies show that using a combination of MACD with a trend-following indicator like the 100 SMA can increase your win rate by up to 60%!
That’s a solid edge in the competitive world of Forex trading.
My Trading Bots and the MACD & 100 SMA Strategy
Now, I don’t just rely on manual trading.
I’ve developed 16 sophisticated trading bots that implement this MACD & 100 SMA strategy, among other methods.
Here’s how they help:
- Diversification: Each bot is tailored to specific currency pairs—EUR/USD, GBP/USD, USD/CHF, and USD/JPY.
- Minimized Risk: My bots are designed to reduce correlated losses through internal diversification.
- Long-Term Performance: They focus on long-term trades, aiming for 200-350 pips, which I’ve backtested for the past 20 years.
I’m offering this EA portfolio completely FREE.
If you’re serious about improving your trading, check out my 16 trading bots portfolio.
You won’t regret it!
Best Brokers for Trading
Finding a trustworthy broker can be a daunting task.
You want one with:
- Tight spreads: So you keep more of your profits.
- Fast execution: Because every second counts.
- Excellent support: For when you need help.
I’ve tested several brokers and can confidently recommend the best.
If you’re looking to start, check out my list of trusted Forex brokers.
Wrapping It Up
So there you have it!
The MACD & 100 SMA Strategy is not just a theory—it’s a simple, effective method for swing trading.
Combine that with my trading bots, and you put yourself in a strong position for success.
Remember, trading is a journey, and having the right tools and strategies can make all the difference.
Stay patient, stay disciplined, and happy trading!
