Last Updated on March 13, 2025 by Arif Chowdhury
Are you struggling to identify when a trend is strong enough to jump in?
Or maybe you find yourself second-guessing your trades, wondering if you’re missing the right signals?
I get it. As a seasoned Forex trader since 2015, I’ve been through the wringer.
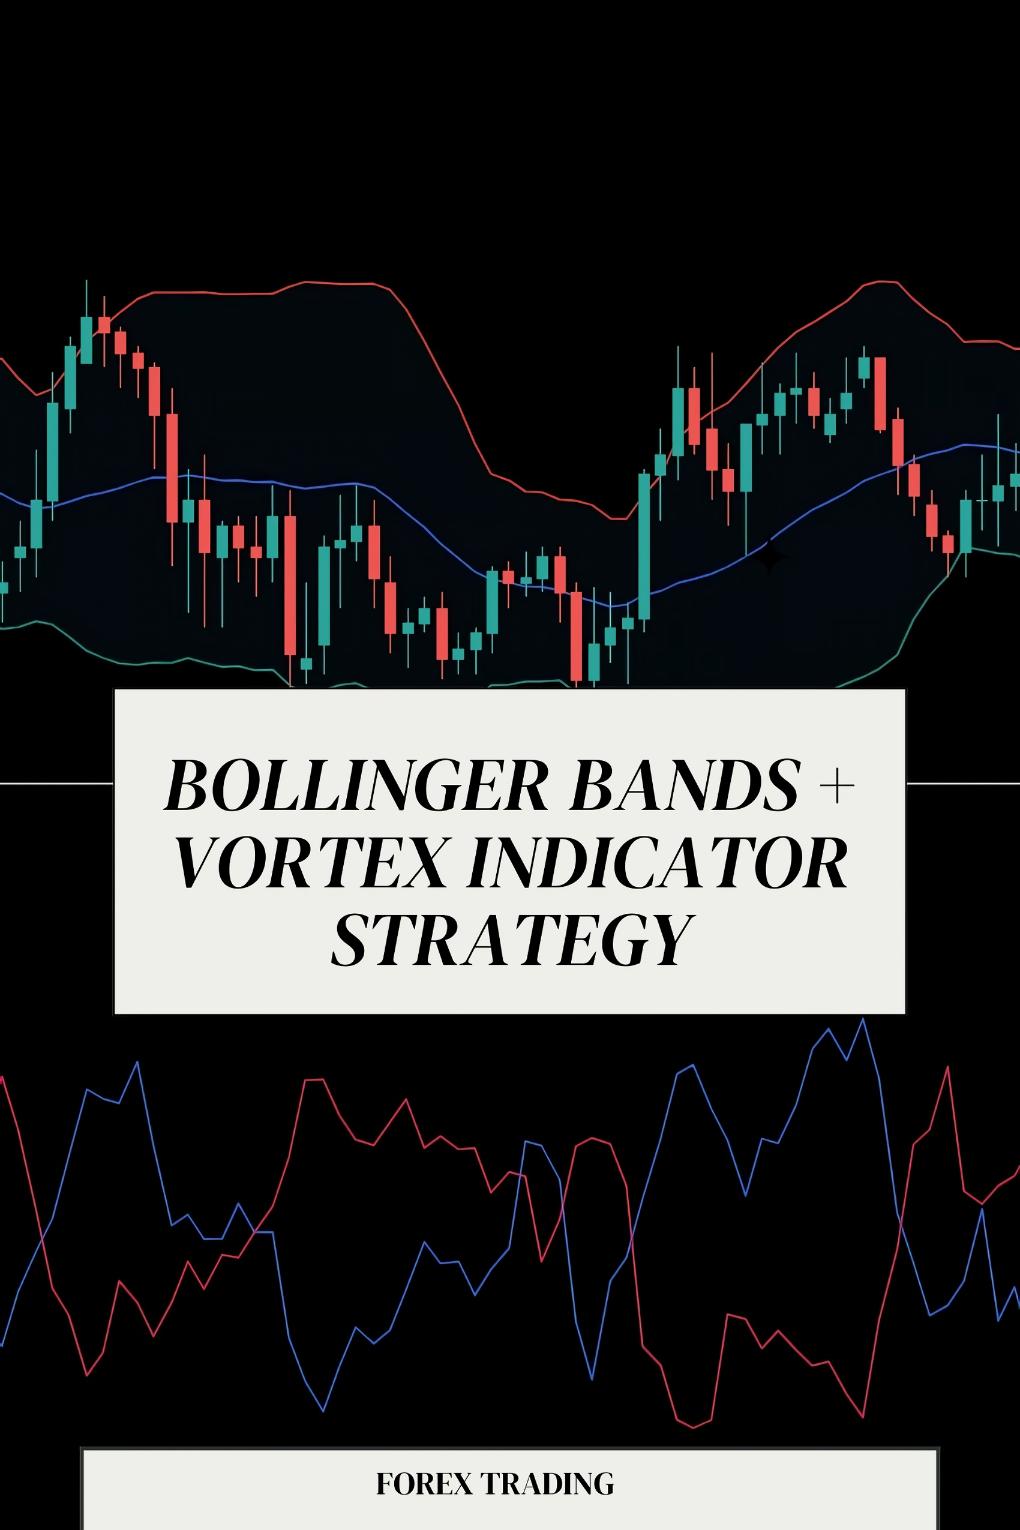
But I’ve developed a strategy that works wonders: the Bollinger Bands + Vortex Indicator Strategy.
Let’s break it down.
Understanding the Basics
First, we need to understand our tools.
Bollinger Bands help us gauge market volatility.
They consist of three lines:
- Middle Band: This is the simple moving average (SMA).
- Upper Band: This is the SMA plus two standard deviations.
- Lower Band: This is the SMA minus two standard deviations.
When the bands widen, volatility increases.
When they constrict, volatility decreases.
This makes them a great tool for spotting potential breakouts or reversals.
On the other hand, the Vortex Indicator (VI) helps us measure trend strength.
It consists of two lines:
- VI+: Measures upward movement.
- VI-: Measures downward movement.
When VI+ crosses above VI-, it signals a potential uptrend.
When VI- crosses above VI+, it indicates a potential downtrend.
Why Use This Combo?
Combining these two indicators gives you a powerful edge.
- Trend Confirmation: Before entering a trade, you can confirm the trend’s strength using the Vortex Indicator.
- Volatility Assessment: Use Bollinger Bands to see if the market is ripe for a breakout.
- Risk Management: By analyzing both, you can make more informed decisions, reducing the chance of losses.
Did you know that studies show traders who use multiple indicators tend to have a 25% higher success rate?
That’s significant!
Setting Up the Strategy
Alright, let’s set up the strategy.
- Identify the Trend: Check the Vortex Indicator.
- Look for Crossovers: If VI+ crosses above VI-, that’s your signal for a potential uptrend.
- Conversely, a crossover of VI- above VI+ indicates a downtrend.
- Check the Bands: Look at the Bollinger Bands.
- If the price is touching or breaking the upper band, it may signal overbought conditions—consider a short.
- If it’s touching or breaking the lower band, it may signal oversold conditions—consider a long.
- Enter the Trade:
- Only enter trades when both indicators align.
- This minimizes false signals and increases your chances of success.
My Trading Bots and Strategy
Now, let me introduce you to my 16 trading bots.
They utilize the Bollinger Bands + Vortex Indicator strategy among many others to diversify risk and maximize profit.
Each bot is tailored for four major currency pairs: EUR/USD, GBP/USD, USD/CHF, and USD/JPY.
Here’s the kicker:
- They’re internally diversified to minimize correlated losses.
- Designed to trade for the long-term, targeting 200-350 pips.
- Backtested over 20 years, they thrive in harsh conditions.
Best of all, I’m offering this entire EA portfolio for FREE.
You can check it out here: My Trading Bots.
Realizing the Potential
Using this strategy can be a game-changer.
The key points to remember:
- Trend Strength: Use the Vortex Indicator to confirm trends.
- Volatility: Use Bollinger Bands to anticipate breakouts.
- Strategic Entry: Align both indicators for optimal trade entries.
Final Thoughts
If you want to take your Forex trading to the next level, consider this strategy.
And remember, to maximize your success, choose the right broker.
I’ve tested many and recommend checking out the best ones here: Top Forex Brokers.
With the right tools and strategies, you can navigate the Forex waters like a pro.