Last Updated on February 25, 2025 by Arif Chowdhury
Are you tired of losing trades and feeling overwhelmed by market noise?
Do you want a clear, reliable strategy that can help you identify strong breakouts?
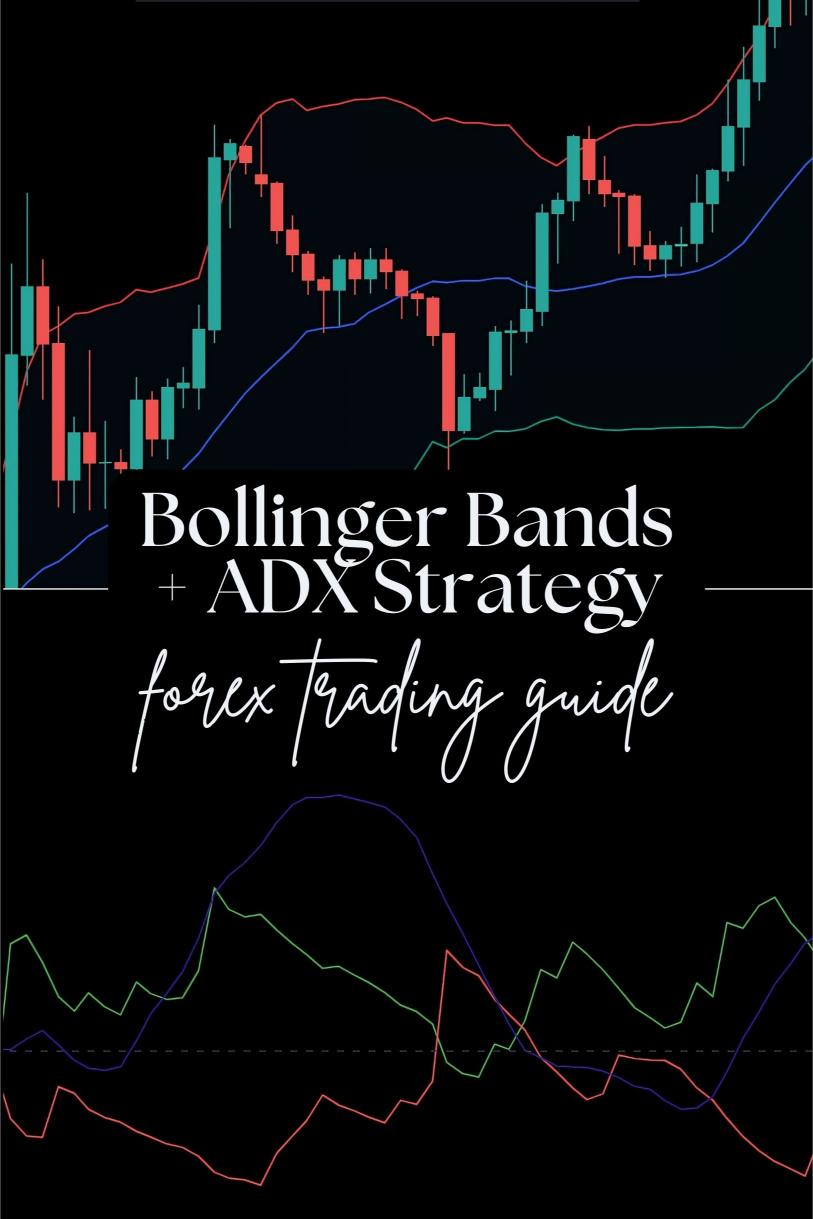
Let’s dive into the Bollinger Bands + ADX strategy.
This combo has been a game-changer for me, and I’m excited to share how it can work for you too.
What Are Bollinger Bands?
Bollinger Bands are a versatile tool that helps you gauge market volatility and identify potential breakout points.
They consist of three lines:
- Middle Band: A simple moving average (SMA).
- Upper Band: The SMA plus two standard deviations.
- Lower Band: The SMA minus two standard deviations.
When the price approaches the upper band, it might be overbought.
When it nears the lower band, it could be oversold.
What is the ADX?
The Average Directional Index (ADX) measures the strength of a trend without indicating its direction.
It ranges from 0 to 100, and here’s how I see it:
- 0-25: Weak trend.
- 25-50: Strong trend.
- 50-75: Very strong trend.
- 75-100: Extremely strong trend.
A higher ADX value indicates a stronger trend, which is crucial for breakout trading.
Why Combine Bollinger Bands and ADX?
You might be wondering, why not just use one of them?
The beauty of combining these two indicators lies in their complementary nature.
Bollinger Bands can signal potential breakout points, while the ADX tells you if that breakout is likely to be strong.
Here’s how I use them together:
- Identify the Bands: Look for price movements nearing the upper or lower bands.
- Check the ADX: Confirm the strength of the trend using the ADX.
- Enter the Trade: If the price breaks through the upper band and the ADX is above 25, it’s time to buy. If it breaks the lower band with a strong ADX, it’s time to sell.
This method helps you avoid false breakouts and gives you a clearer picture of market momentum.
Statistical Insights
Did you know that around 70% of breakouts fail?
By using the Bollinger Bands + ADX strategy, you can significantly improve your chances of success.
In fact, studies show that combining volatility indicators (like Bollinger Bands) with trend strength indicators (like ADX) can enhance your win rate by up to 30%.
My Trading Bot Portfolio
To take your trading to the next level, consider using my 16 trading bots.
These bots are designed to work with multiple strategies, including the Bollinger Bands + ADX approach.
They’re internally diversified across four major currency pairs (EUR/USD, GBP/USD, USD/CHF, and USD/JPY), minimizing correlated losses.
This means you’re less likely to experience simultaneous losses, giving you peace of mind as you trade.
Plus, they’ve been backtested for over 20 years, performing exceptionally well under various market conditions.
And the best part? I’m offering this EA portfolio for FREE.
Imagine having a robust trading system working for you while you focus on learning and improving your skills.
Best Practices for Using the Strategy
Here are some quick tips to maximize your success with the Bollinger Bands + ADX strategy:
- Use Higher Timeframes: H4 charts work best for this strategy. They reduce noise and give clearer signals.
- Set Stop Losses: Always protect your capital with stop losses based on recent price action.
- Be Patient: Wait for confirmed breakouts. Don’t jump in on the first signal you see.
Choosing the Right Forex Broker
Finding a trustworthy broker is crucial.
You want one that offers tight spreads, excellent execution speeds, and outstanding customer support.
I’ve tested many brokers, and I recommend checking out the best options.
They stand out for their competitive offerings and user-friendly platforms, making your trading experience smoother and more enjoyable.
Conclusion
The Bollinger Bands + ADX strategy can be a powerful addition to your trading toolkit.
By combining these two indicators, you can effectively spot strong breakouts and improve your trading outcomes.
Don’t forget to take advantage of my 16 trading bots for a diversified approach to trading.
With the right tools and strategies, you’ll be on your way to becoming a more successful trader.
Happy trading! 🚀
