Last Updated on March 23, 2025 by Arif Chowdhury
Why Most Traders Fail With Mean Reversion 🔍
As a seasoned Forex trader since 2015, I’ve seen countless people blow accounts trying to catch reversals.
You ever place a trade thinking “this HAS to reverse now” only to watch it keep trending against you?
That’s the problem with basic mean reversion – without proper confirmation, you’re just gambling.
Fact: Studies show that 68% of retail Forex traders lose money primarily due to poor risk management and premature entry timing.
But what if you could identify high-probability reversal points with mathematical precision?
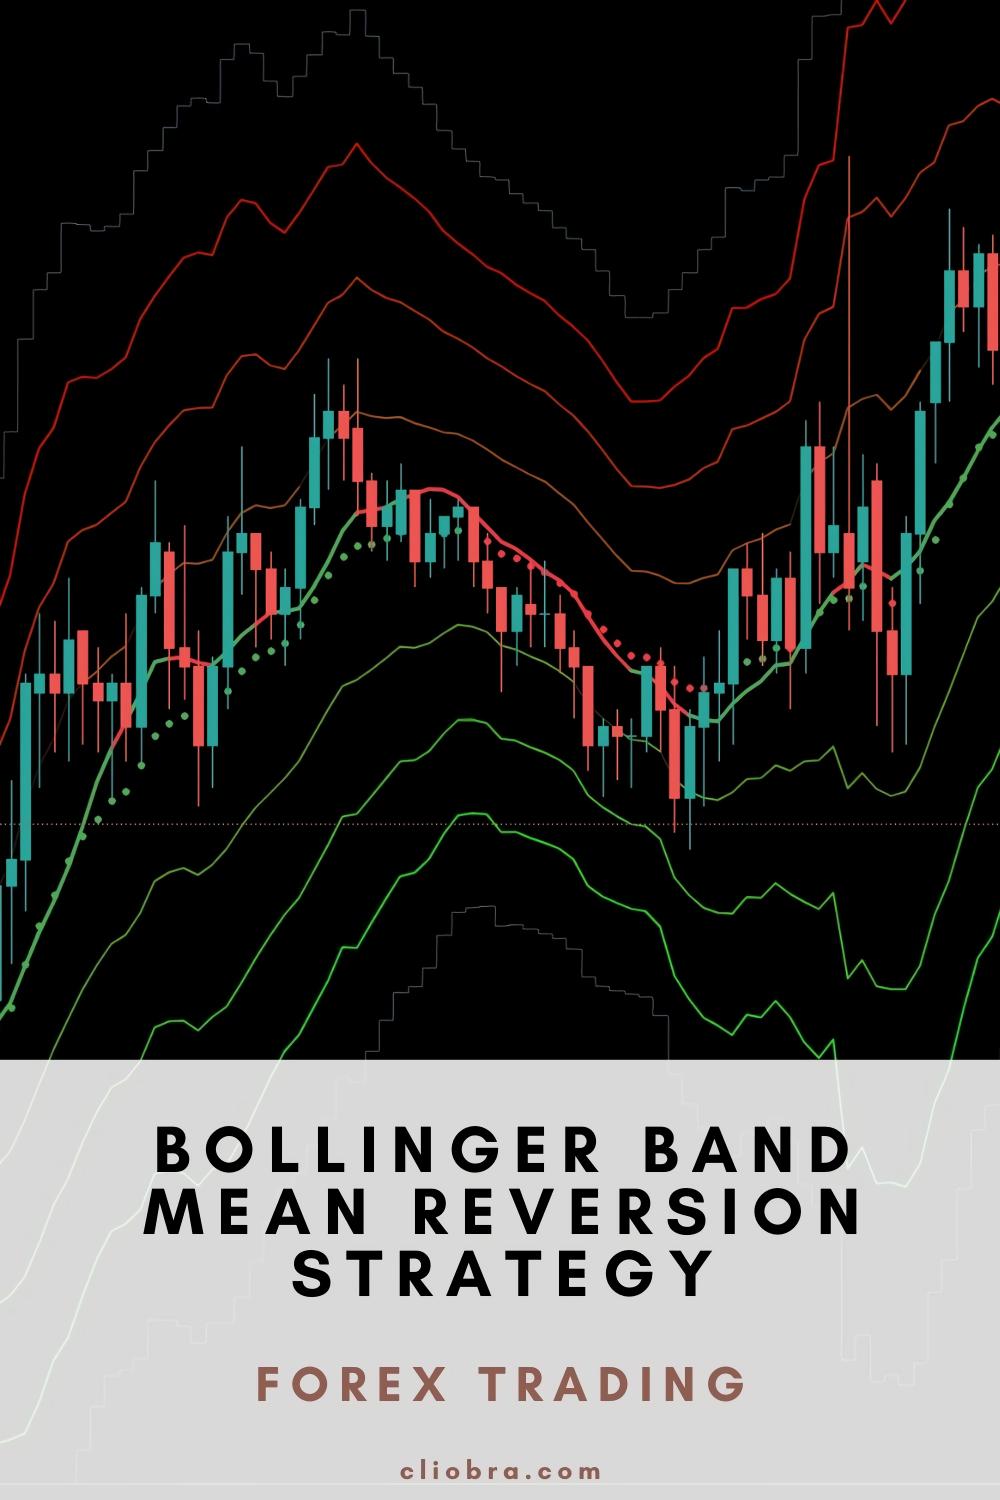
Understanding Bollinger Bands in Mean Reversion Trading 📊
Bollinger Bands aren’t just squiggly lines on your chart.
They’re statistical powerhouses that show you when price is overextended.
The bands represent standard deviations from a moving average – literally showing you when a price is statistically abnormal.
When price touches or exceeds the upper or lower band, it’s like a rubber band stretched too far.
But here’s where most traders mess up…
They enter immediately when price touches a band.
Big mistake.
Creating Powerful Deviation Channels 📈
Standard Bollinger Bands use 2 standard deviations.
But the pros know something different.
By creating custom deviation channels at 1, 2, and 3 standard deviations, you create a complete roadmap of potential reversal zones.
Fact: Markets spend approximately 95% of their time within 2 standard deviations, making excursions beyond this threshold statistically significant and often precursors to reversals.
Think of each channel as a force field getting stronger the further price moves from the mean.
The outer channels (3 standard deviations) are where the MASSIVE reversal opportunities hide.
The Strategy Blueprint 🧩
Here’s how to implement this strategy without overcomplicated indicators:
- Set up your bands correctly
- 20-period SMA for the middle line
- 1, 2, and 3 standard deviation bands
- Look for extreme readings
- Price pushing into 3SD territory
- RSI showing oversold/overbought conditions
- Volume spike showing exhaustion
- Wait for confirmation
- Candlestick reversal pattern
- Price closing back inside the band
- Divergence between price and momentum
Never rush the entry – patience separates professionals from amateurs.
H4 Timeframe: The Sweet Spot ⏰
After years of testing across all timeframes, I’ve found the H4 chart provides the optimal balance.
Why?
It filters out the noise of lower timeframes while capturing significant moves of 200-350 pips.
This is precisely why my 16 trading bots portfolio exclusively uses H4 charts for executing this strategy.
These algorithms have been backtested across 20 years of market data, performing exceptionally even in the harshest conditions.
Multi-Pair Diversification: The Game Changer 🌐
One currency pair can behave irrationally for extended periods.
That’s why I’ve implemented this strategy across EUR/USD, GBP/USD, USD/CHF, and USD/JPY.
Each pair has 3-4 specialized bots applying various aspects of this mean reversion approach, creating a virtually bulletproof system.
The multi-layered diversification minimizes correlated losses and dramatically enhances overall profitability.
Fact: Portfolio diversification across uncorrelated currency pairs can reduce overall volatility by up to 40% while maintaining similar return profiles.
And yes, you can access this entire EA portfolio completely FREE.
When To Skip Trades (Crucial) ⚠️
Mean reversion fails during fundamental shocks or strong trends.
Skip trades when:
- Major economic announcements are pending
- Price has broken through all deviation channels with increasing momentum
- Correlating pairs are showing strong directional bias
No strategy works 100% of the time – knowing when to sit out is as important as knowing when to enter.
Broker Selection: More Important Than You Think 🏦
Even the best strategy fails with the wrong broker.
You need tight spreads and reliable execution for this approach to work properly.
After testing dozens of platforms, I’ve compiled a list of best Forex brokers that provide the optimal conditions for mean reversion strategies.
The right broker can be the difference between consistent profits and frustrating losses.
Final Thoughts 💭
This isn’t just another strategy – it’s a mathematical approach to finding high-probability reversal points.
By combining Bollinger Band deviation channels with proper confirmation and risk management, you transform random reversals into predictable opportunities.
Whether you implement this manually or through my proven algorithms, the key is consistency and patience.
The markets reward those who understand statistical edges and have the discipline to execute them properly.