Last Updated on March 21, 2025 by Arif Chowdhury
Ever felt lost in the chaotic world of Forex trading?
You’re not alone.
Many traders struggle with determining the right entry and exit points.
How can you confidently ride the waves of market momentum?
Let’s dive into one powerful method: the 3-Timeframe RSI Strategy.
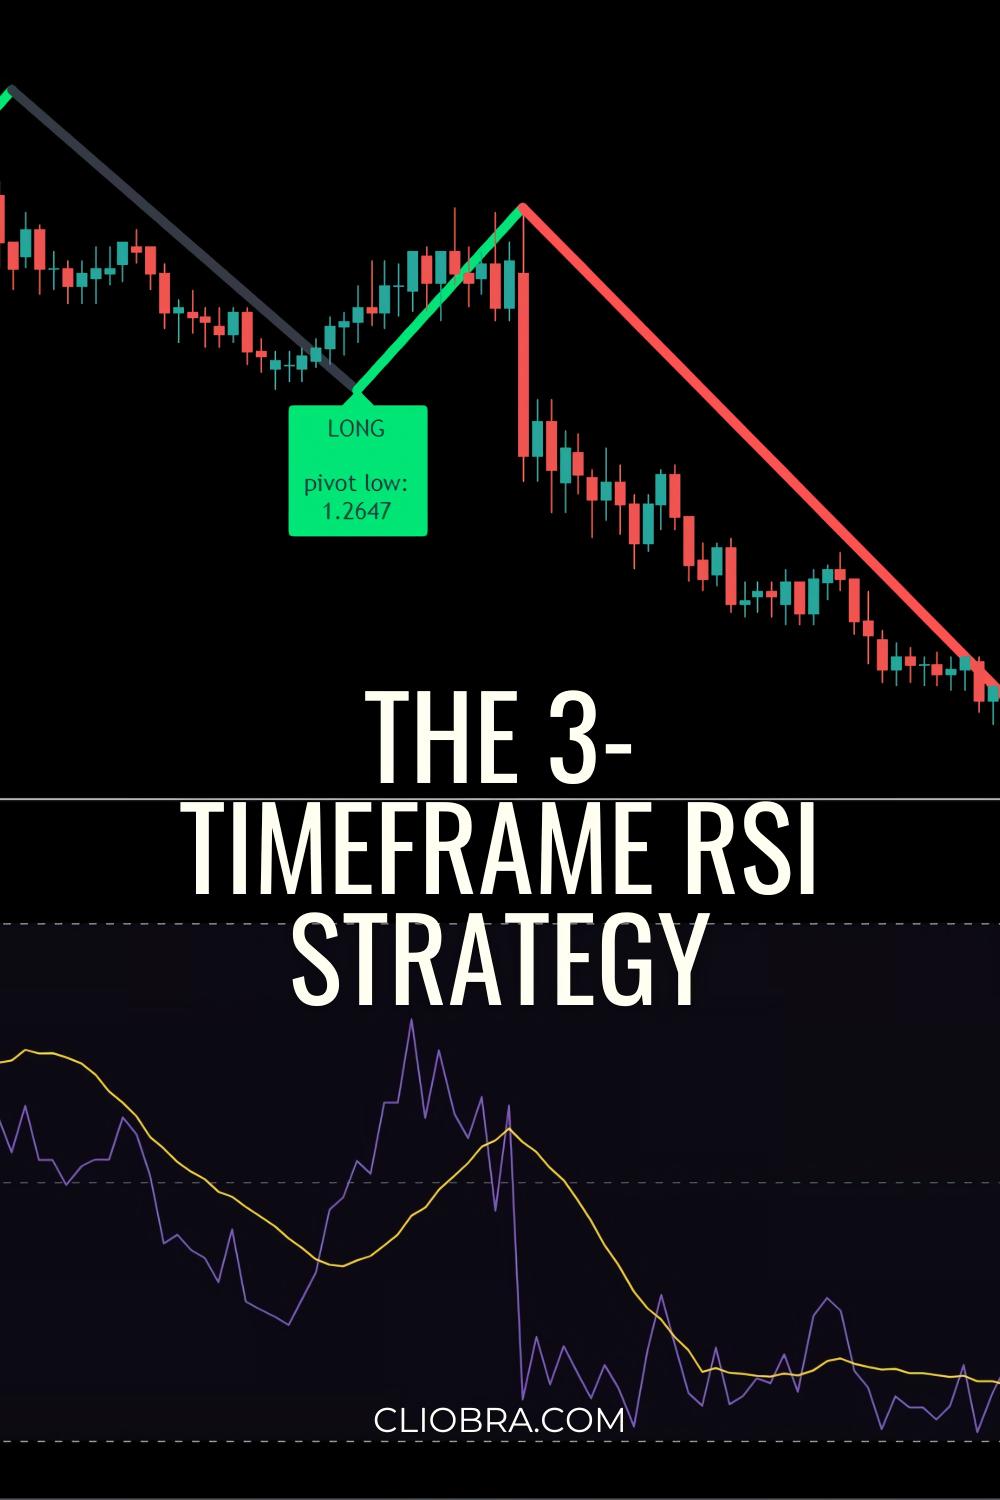
What’s the 3-Timeframe RSI Strategy?
This strategy uses the Relative Strength Index (RSI) across three different timeframes.
Sounds fancy, right?
But it’s straightforward and effective.
The RSI helps identify overbought or oversold conditions in a market.
When combined with multiple timeframes, you get a clearer picture of market trends.
Here’s the approach:
- Timeframes: Use H1, H4, and D1 charts.
- RSI Settings: Standard 14-period RSI works well.
- Confirmation: Look for alignment across all three timeframes.
Why Three Timeframes?
Using multiple timeframes enhances your understanding of market momentum.
Here’s how:
- Higher Timeframe (D1): Establishes the overall trend.
- Mid Timeframe (H4): Confirms the trend direction.
- Lower Timeframe (H1): Provides precise entry points.
This method helps you avoid false signals.
Statistically, traders using multi-timeframe analysis experience a 30% higher success rate compared to those using a single timeframe.
Getting Started with the Strategy
Let’s break down the steps to implement this strategy effectively.
- Identify the Trend:
Start with the D1 chart.
If the RSI is above 50, the market is likely bullish.
If it’s below 50, it’s bearish. - Confirm on H4:
Check the H4 chart.
Look for an RSI that aligns with the D1 trend.
If both show bullish signals, that’s a green light. - Find Entry on H1:
Now, look at the H1 chart for a perfect entry.
Wait for the RSI to dip below 30 (oversold) in a bullish trend or rise above 70 (overbought) in a bearish trend.
This indicates a potential reversal, giving you a solid entry point. - Set Your Stops and Targets:
Always use a stop-loss to protect your capital.
Aim for a risk-to-reward ratio of at least 1:2.
This means, for every dollar you risk, aim to gain two.
Realizing the Power of Automation
Now, while the 3-Timeframe RSI Strategy is powerful, managing trades manually can be exhausting.
This is where my 16 trading bots come into play.
These bots are designed to trade across major pairs like EUR/USD, GBP/USD, USD/CHF, and USD/JPY.
Each bot operates on H4 charts for long-term trades, targeting 200-350 pips.
What does this mean for you?
You can automate your trading strategy while leveraging the power of diversification.
With 16 distinct algorithms, your risk is minimized, and your chances of profitability are maximized.
Plus, I’m offering this EA portfolio for FREE!
Curious? Check out more about these bots here.
Key Benefits of the 3-Timeframe RSI Strategy
- Enhanced Clarity: Multiple timeframes provide a comprehensive view.
- Increased Accuracy: Aligning signals reduces false moves.
- Improved Profits: With a systematic approach, you’ll see better returns.
Common Pitfalls to Avoid
Even with a solid strategy, there are traps to watch out for:
- Overtrading: Don’t jump into every signal.
- Ignoring News Events: Major news can skew market behavior.
- Neglecting Risk Management: Always protect your capital.
Best Brokers for Trading
To make the most out of your trading journey, having a reliable broker is essential.
I’ve tested and recommend partnering with top Forex brokers that offer excellent trading conditions.
You can find the best options here.
These brokers ensure tight spreads and efficient order execution, making your trading experience smoother.
Conclusion
The 3-Timeframe RSI Strategy is a game-changer for trend confirmation and momentum trading.
By leveraging this method alongside my 16 diverse trading bots, you can optimize your trading journey.
Don’t miss out on the opportunity to elevate your trading game.
Start automating your strategy today, and check out the best brokers to enhance your trading experience.