Last Updated on March 18, 2025 by Arif Chowdhury
Ever feel like you’re chasing your tail in the Forex market?
Are you tired of guessing which way the market will swing next?
Well, I’ve been in your shoes since 2015, and I can tell you that mastering the Sentiment Index and the Accumulation/Distribution Line (A/D) can be game-changers for identifying market extremes.
Let’s break this down together.
Understanding Market Sentiment
Market sentiment reflects the overall attitude of traders toward a particular market or asset.
When sentiment is bullish, traders are generally expecting prices to rise. Conversely, bearish sentiment indicates a belief that prices will fall.
But how do you measure this?
The Sentiment Index
The Sentiment Index is a tool that gauges the mood of the market.
It’s based on the ratio of long to short positions.
Here’s how to use it:
- Watch for Extremes: When sentiment becomes overly bullish or bearish, it’s often a sign that the market is nearing a reversal.
- Combine with Price Action: Look for price action that contradicts sentiment. For example, if sentiment is extremely bullish but price starts to fall, it might be time to consider a short position.
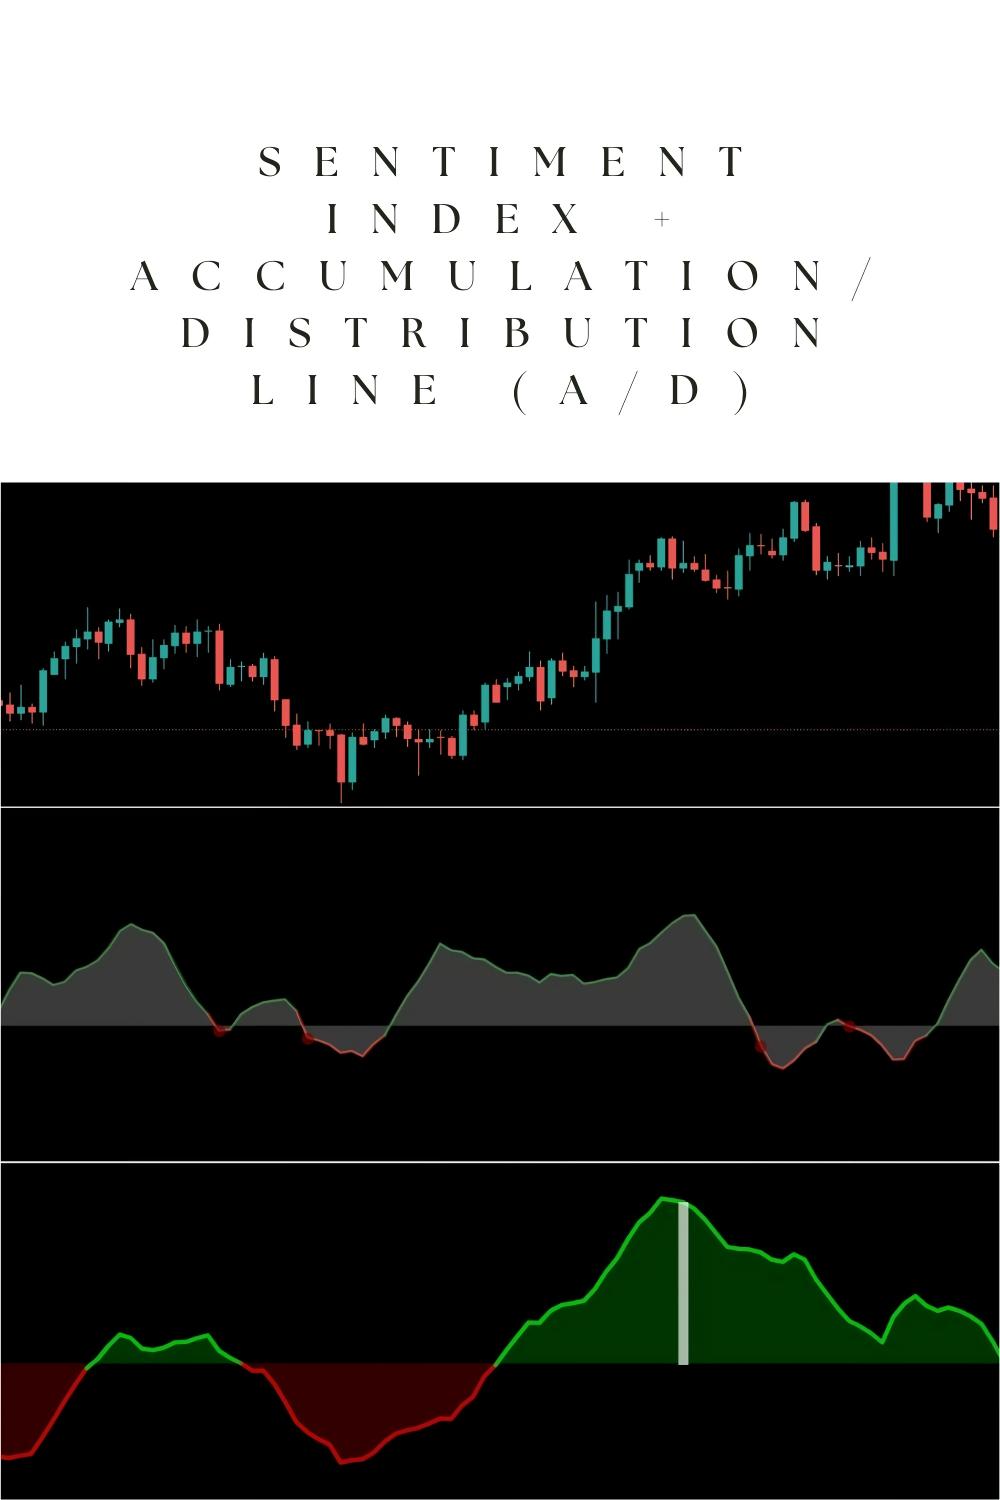
The Accumulation/Distribution Line (A/D)
The A/D line adds another layer to your analysis.
It helps you understand whether money is flowing into or out of a currency pair.
Here’s how to effectively use the A/D line:
- Identify Trends: If the A/D line is rising while prices are falling, it indicates accumulation, suggesting a potential upward reversal.
- Spot Divergences: If prices are making new highs but the A/D line isn’t, it’s a red flag. This divergence can signal a weakening trend.
Combining Sentiment Index and A/D for Market Extremes
Now, let’s talk about how to combine these two tools for better trading decisions.
- Look for Contradictions: If the Sentiment Index shows extreme bullishness while the A/D line indicates distribution, it’s time to be cautious.
- Confirm with Volume: High trading volume during price increases, paired with a rising A/D line, suggests strength. Low volume with a high Sentiment Index? Not so much.
- Use Multi-Timeframe Analysis: Analyze both the Sentiment Index and A/D on different timeframes. This gives a clearer picture of market sentiment and potential reversals.
My Trading Strategy
Since 2015, I’ve honed my trading strategy by integrating multiple approaches, including the Sentiment Index and A/D.
This has helped me create a robust portfolio of 16 sophisticated trading bots that operate across major currency pairs like EUR/USD, GBP/USD, USD/CHF, and USD/JPY.
These bots are not only diversified but also designed to minimize risks.
Each pair has 3-4 EAs that work together, ensuring that if one bot faces challenges, others can compensate.
This multi-layered diversification significantly enhances profitability while reducing the likelihood of simultaneous losses.
And here’s the kicker: I’m offering this EA portfolio for FREE.
You can leverage these strategies and insights without any cost. If you’re serious about your trading, check out my trading bots portfolio.
Why Use Trusted Forex Brokers?
Finding a reliable broker is crucial for your trading success.
The right broker offers:
- Tight Spreads: Lower costs mean more profit in your pocket.
- Fast Execution: Timing is everything in Forex.
- Excellent Customer Support: You need help sometimes; make sure it’s there.
I’ve tested various brokers, and I recommend checking out the best Forex brokers available today. They can give you the edge you need.
Final Thoughts
Using the Sentiment Index and Accumulation/Distribution Line can help you spot market extremes and make informed trading decisions.
Remember to watch for contradictions between sentiment and price movement, and don’t underestimate the power of volume.
And if you want to step up your game, my 16 trading bots are designed to implement these strategies effectively, helping you navigate the complexities of Forex trading.
Trade smart, and let’s tackle the markets together!