Last Updated on February 25, 2025 by Arif Chowdhury
Ever felt like you’re missing the perfect entry point?
Or maybe you’ve watched the market dance, only to jump in too late?
I’ve been there. As a seasoned Forex trader since 2015, I’ve navigated those frustrating waters.
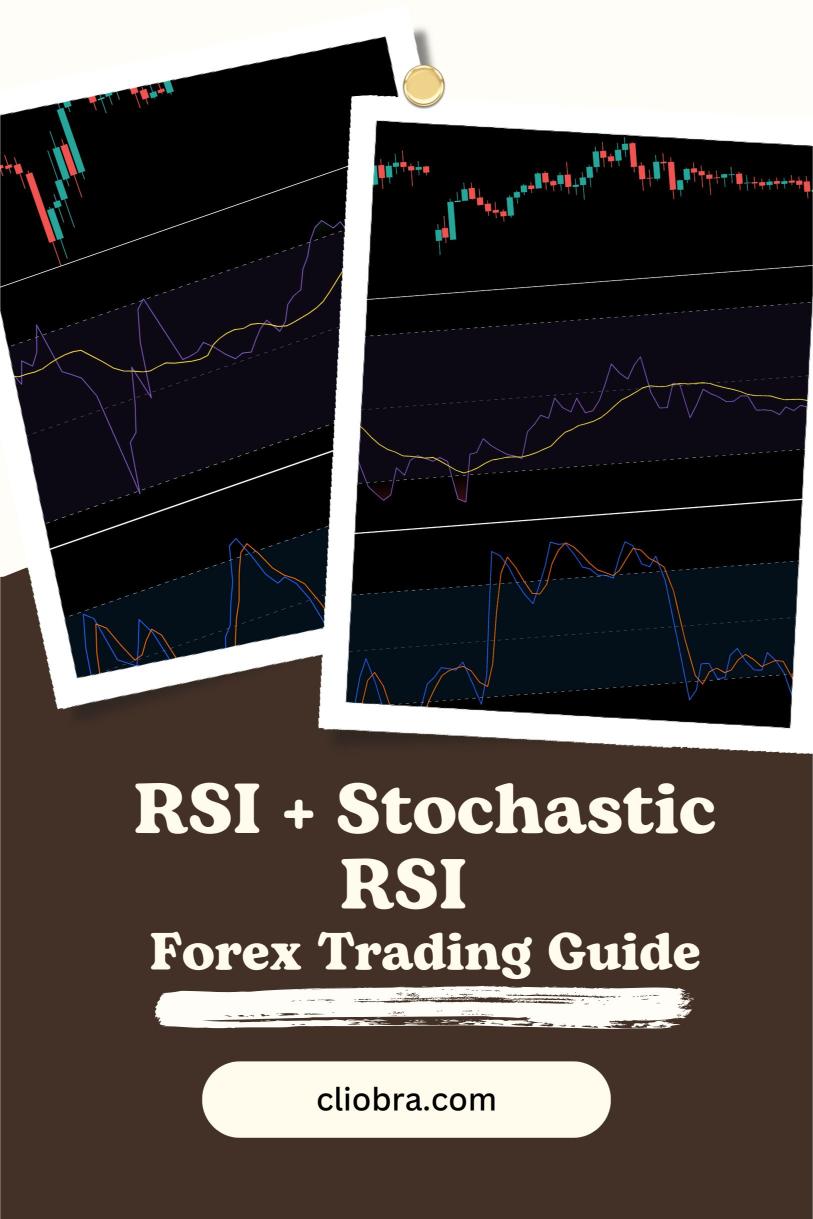
But here’s the good news: using the RSI and Stochastic RSI together can sharpen your entry precision to a razor’s edge.
Let’s break it down.
What Are RSI and Stochastic RSI?
Relative Strength Index (RSI)
- Measures the speed and change of price movements.
- Ranges from 0 to 100.
- Typically, over 70 indicates overbought conditions, while under 30 points to oversold.
Stochastic RSI
- It’s an indicator of an indicator.
- Measures the RSI’s momentum.
- Also ranges from 0 to 1, with key levels typically set at 0.8 (overbought) and 0.2 (oversold).
Why Use Them Together?
Combining these indicators gives you a clearer picture.
Statistical Insight: Studies show that traders using multiple indicators can increase their success rate by up to 20%.
By using RSI with Stochastic RSI, you can:
- Confirm overbought or oversold conditions.
- Filter out false signals.
- Enhance your entry points.
Setting Up Your Charts
- Add RSI to your chart.
- Set the period to 14 (standard).
- Add Stochastic RSI.
- Use the same period of 14.
- Set the K period to 3 and the D period to 3 for smoother signals.
Identifying Entry Points
Here’s how to pinpoint those golden entry spots:
- Look for Divergence:
- If price makes a new high but RSI doesn’t, that’s a bearish divergence.
- If price makes a new low but RSI doesn’t, that’s bullish divergence.
- Check Overbought/Oversold Levels:
- When RSI is above 70 and Stochastic RSI is above 0.8, consider selling.
- When RSI is below 30 and Stochastic RSI is below 0.2, consider buying.
- Crossovers:
- Watch for the Stochastic RSI lines (K and D) to cross.
- A K line crossing above the D line in oversold territory suggests a buy.
- A K line crossing below the D line in overbought territory suggests a sell.
My Trading Bots and Their Magic
Now, let’s talk about my 16 trading bots.
Each one is designed with multiple strategies, including the RSI + Stochastic RSI approach.
These bots specialize in major pairs like EUR/USD, GBP/USD, USD/CHF, and USD/JPY, ensuring:
- Robust Diversification: Each pair has 3-4 unique bots.
- Risk Mitigation: They’re internally diversified to minimize correlated losses.
- Long-Term Focus: Designed to target 200-350 pips, they excel over time.
And the best part? You can access this EA portfolio for FREE.
Simply deposit a minimum of $500 with a trusted broker, and you can set these bots to work for you.
Risk Management
Even with solid indicators, remember:
- Market conditions are unpredictable.
- Trading involves risks.
Always set your stop-losses.
Final Thoughts on Brokers
To maximize your trading experience, you need a reliable broker.
I’ve tested several and can confidently say that choosing the right one is essential for success.
Check out the best forex brokers I recommend.
It’s a win-win situation, just like my trading journey.
Wrap-Up
Ready to enhance your entry precision?
Using RSI and Stochastic RSI together is a game-changer.
And don’t forget to leverage my 16 trading bots for added support.
Happy trading! 🚀
