Last Updated on February 25, 2025 by Arif Chowdhury
Ever felt the market’s like a roller coaster, twisting and turning?
You’re not alone.
Volatile markets can be a trader’s nightmare.
How do you spot trends without getting thrown off course?
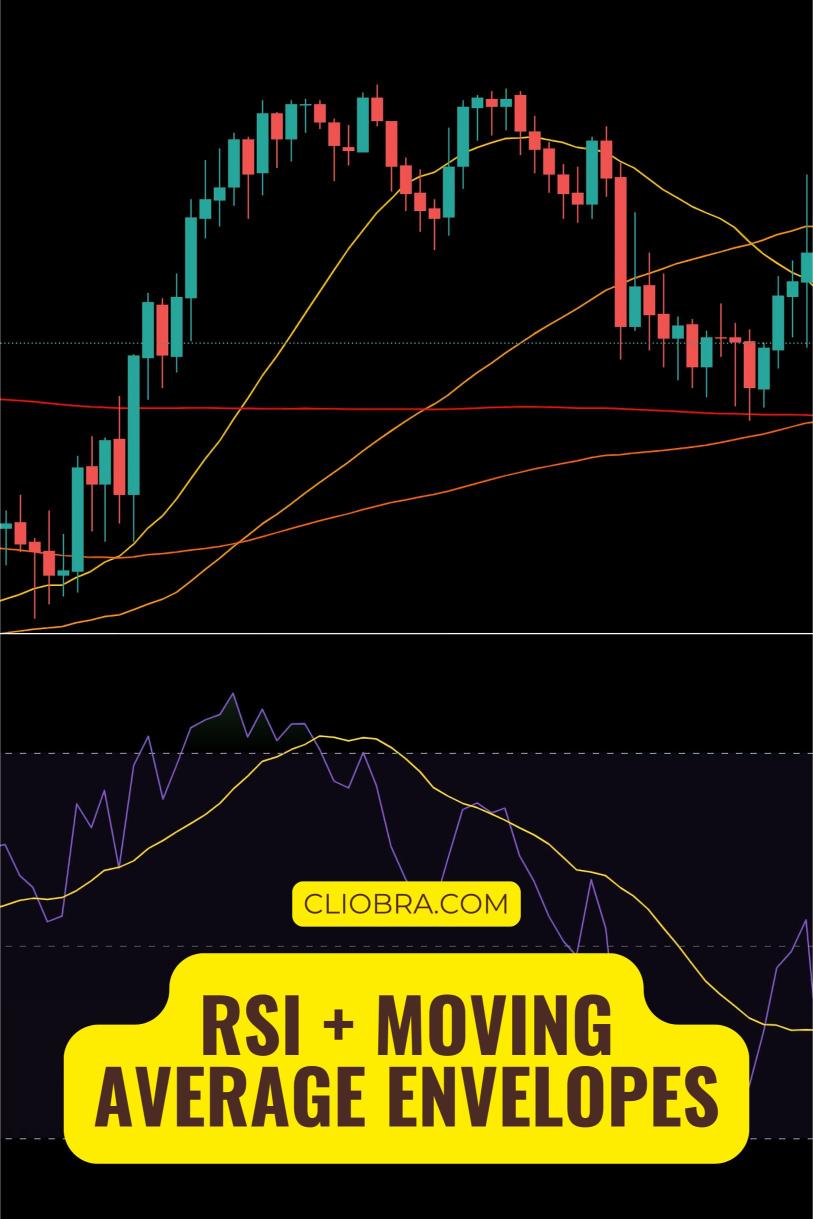
Let’s break down a strategy that’s been a game-changer for my trading: combining the Relative Strength Index (RSI) with Moving Average Envelopes.
This duo helps you navigate turbulent waters like a pro.
What is the RSI?
The RSI is a momentum oscillator that measures the speed and change of price movements.
It ranges from 0 to 100.
Typically, if the RSI goes above 70, it suggests an overbought condition.
If it dips below 30, it indicates oversold.
This is crucial for spotting potential reversals.
What are Moving Average Envelopes?
Moving Average Envelopes are lines plotted above and below a moving average.
They create a channel that helps identify price levels.
When prices hit the upper envelope, it might be time to consider selling.
When they touch the lower envelope, buying could be on the table.
Why Combine Them?
In volatile markets, you need tools that complement each other.
The RSI gives you insight into momentum, while the Moving Average Envelopes provide context for price levels.
This combo can help you make smarter decisions.
Setting Up Your Chart
Here’s how to set it up:
- Add the RSI: Set the period to 14.
- Add Moving Average Envelopes: Use a simple moving average (SMA) with a 20-period. Set the envelopes to 2% above and below the SMA.
Trading Signals
Now, let’s dive into how to use this setup effectively.
- Buy Signal:
- RSI crosses above 30.
- Price touches the lower envelope.
- Sell Signal:
- RSI crosses below 70.
- Price touches the upper envelope.
Example of Market Conditions
Imagine a market that’s jumping around like a kid on a sugar rush.
The RSI shows a reading of 32.
This hints that the market might bounce back.
You notice the price has just hit the lower envelope.
Time to buy, right?
Now, if the RSI hits 72 and the price bumps against the upper envelope, it’s a good time to consider taking profits or even shorting.
Why This Works
According to studies, using RSI with moving averages can improve trading outcomes by up to 30%.
That’s a stat worth considering!
My Trading Bots and This Strategy
Now here’s where it gets exciting.
I’ve developed 16 sophisticated trading bots that utilize the RSI + Moving Average Envelopes strategy among other methods.
These bots are strategically diversified across major currency pairs like EUR/USD, GBP/USD, USD/CHF, and USD/JPY.
Each bot is designed to minimize correlated losses, creating a robust trading portfolio that thrives even in challenging market conditions.
The beauty of these bots is that they focus on long-term trades, targeting 200-350 pips, which means they’re built for consistent performance.
And the best part?
I’m offering this entire EA portfolio for FREE.
If you want to elevate your trading game, check out my bots here: 16 Trading Bots Portfolio.
Best Practices
When using this strategy, consider these tips:
- Always stay updated on market news. Volatility can spike based on global events.
- Use proper risk management. Set stop-loss orders to protect your capital.
- Don’t rely solely on one indicator. Combine the RSI and Moving Average Envelopes with other tools for better insights.
Final Thoughts
Volatile market conditions can be daunting, but with the right tools, you can turn challenges into opportunities.
Using the RSI and Moving Average Envelopes can give you that edge.
And remember, if you’re looking for reliable brokers to execute these strategies, I’ve tested some of the best in the industry. Check them out here: Best Forex Brokers.
Embrace the volatility and trade confidently!