Last Updated on April 2, 2025 by Arif Chowdhury
Ever felt like you’re swimming in a sea of numbers and charts without a lifebuoy?
You’re not alone.
As a seasoned Forex trader since 2015, I’ve been there.
The market can be overwhelming, and figuring out where to focus your energy is crucial.
Today, let’s simplify things and dive into the Price Rate of Change (ROC) Indicator.
This tool can be your compass for spotting trend strength.
Let’s break it down.
What is the Price Rate of Change (ROC)?
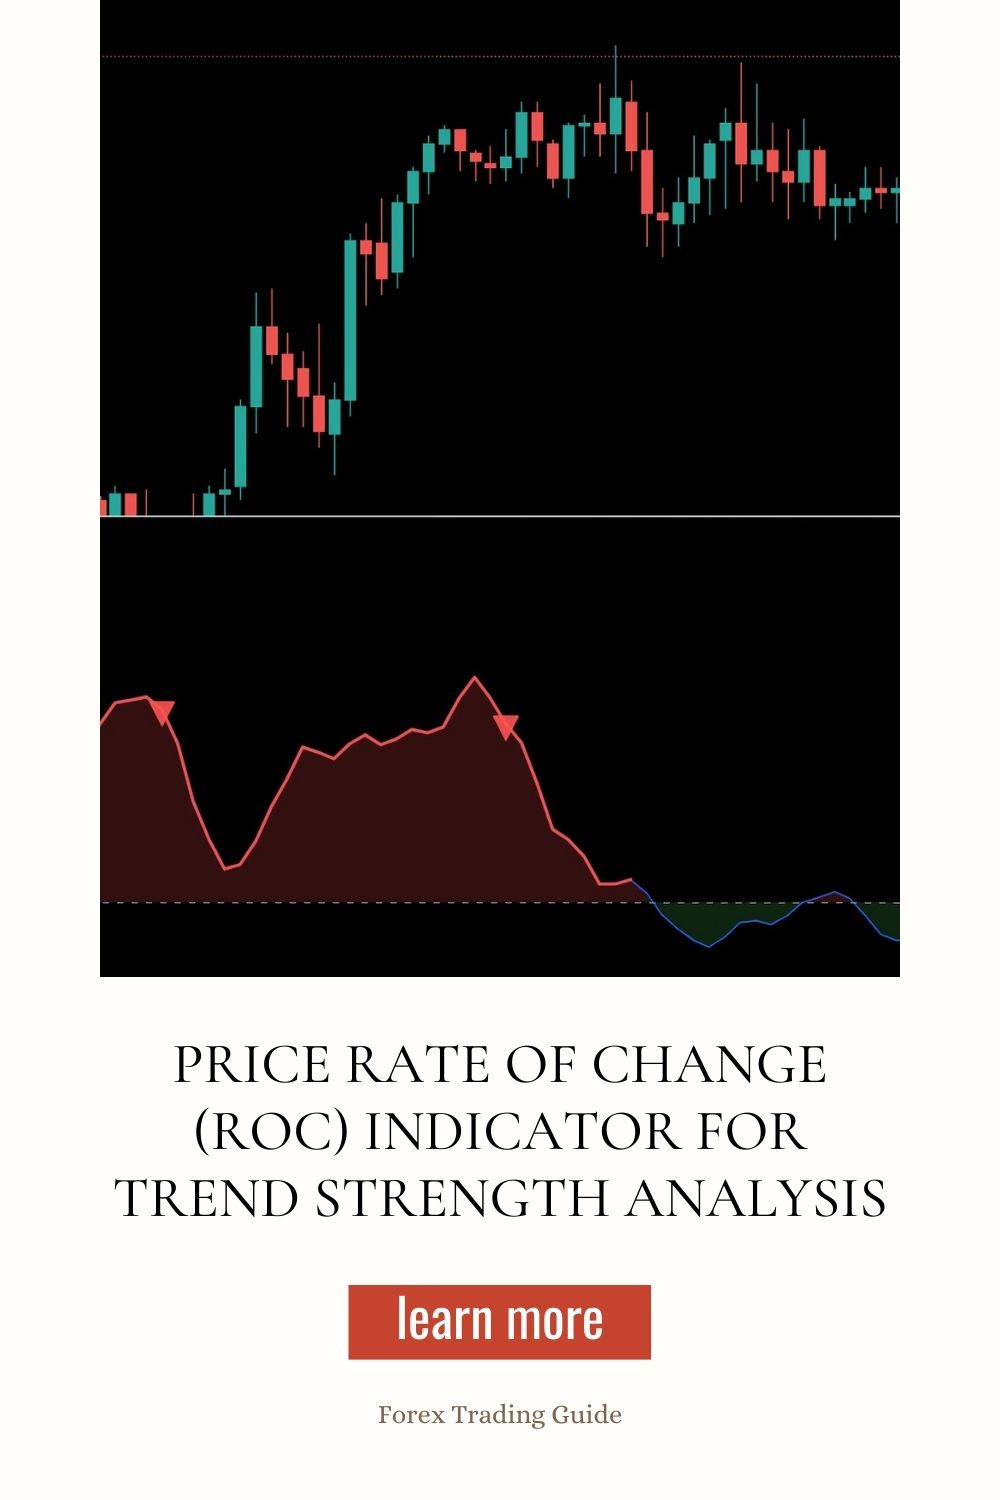
The ROC measures the percentage change in price over a specified time frame.
Think of it as a speedometer for price movement.
When the ROC is positive, the price is rising. When it’s negative, the price is falling.
It’s straightforward and incredibly effective for identifying trends.
Key Points About ROC:
- Calculation: ROC = [(Current Price – Price n periods ago) / Price n periods ago] × 100
- Time Frames: You can use it on any time frame—1 minute, 1 hour, or daily.
- Trend Confirmation: A rising ROC indicates a strengthening trend. A falling ROC suggests a weakening trend.
Why Use ROC for Trend Strength Analysis?
Many traders overlook this gem.
But here’s the deal:
- Clarity: It cuts through the noise and helps you see the market’s true momentum.
- Early Signals: ROC can give you early warnings about potential reversals or trend continuations.
- Statistical Insight: Studies show that using momentum indicators like ROC can improve trading success rates by up to 20%.
Now, let’s get into the nitty-gritty of how to use this indicator effectively.
How to Use the ROC Indicator
Setting Up the ROC
- Choose Your Time Frame: Decide if you’re day trading or holding longer positions.
- Select the Period: A common choice is 14 periods, but adjust based on your strategy.
Interpreting ROC Values
- Above Zero: The price is trending upwards. Look for buying opportunities.
- Below Zero: The price is trending downwards. Consider selling.
- Divergence: If the price is making new highs but the ROC isn’t, there’s a potential reversal.
ROC Crossovers
- Above 5%: Strong bullish momentum. This could be your cue to enter a buy position.
- Below -5%: Strong bearish momentum. Might be time to sell.
Enhancing Your Strategy with Golden Grid EA
Now, let’s spice things up.
While mastering the ROC is fantastic, you can supercharge your results with my Golden Grid EA.
Here’s why it’s a game changer:
- Immediate Execution: No waiting around for signals. It starts trading right away, capturing 20-40 short pips in quick succession.
- Profit Potential: I consistently achieve 2-5% ROI daily. Imagine what that could mean for your trading!
- Versatile: Works across all currency pairs, but really shines on Gold (XAU/USD).
- Risk Management: Always test on a demo account first to understand its capabilities.
You can get my Golden Grid EA for FREE. Trust me, this could be your ticket to a more profitable trading experience.
Final Thoughts on Trend Strength Analysis
Using the ROC indicator can significantly enhance your trading strategy.
When paired with tools like my Golden Grid EA, you’re setting yourself up for success.
Best Forex Brokers for Your Trading Journey
To maximize your trading potential, you need a reliable broker.
Choosing the right one can make a world of difference.
Here are some of the best Forex brokers I’ve tested:
- FBS: Tight spreads starting at 0.7 pips, no commission, and instant withdrawals.
- XM: Zero costs with no swap fees, and a minimum deposit of just $5.
- TickMill: Fast execution with spreads as low as 0.7 pips.
If you want more information, check out the top forex brokers I’ve handpicked for you.
Wrap-Up
In summary, mastering the Price Rate of Change (ROC) Indicator is vital for any trader looking to analyze trend strength.
Combine this knowledge with the power of my Golden Grid EA, and you’ve got a winning formula.
Start small, manage your risks, and watch your trading journey unfold.
You’ve got this!
