Last Updated on February 25, 2025 by Arif Chowdhury
Ever found yourself staring at a chart, wondering when to jump into a trade?
You’re not alone.
As a seasoned Forex trader since 2015, I’ve faced that same frustration.
The markets can be unpredictable, and it’s easy to get lost in the noise.
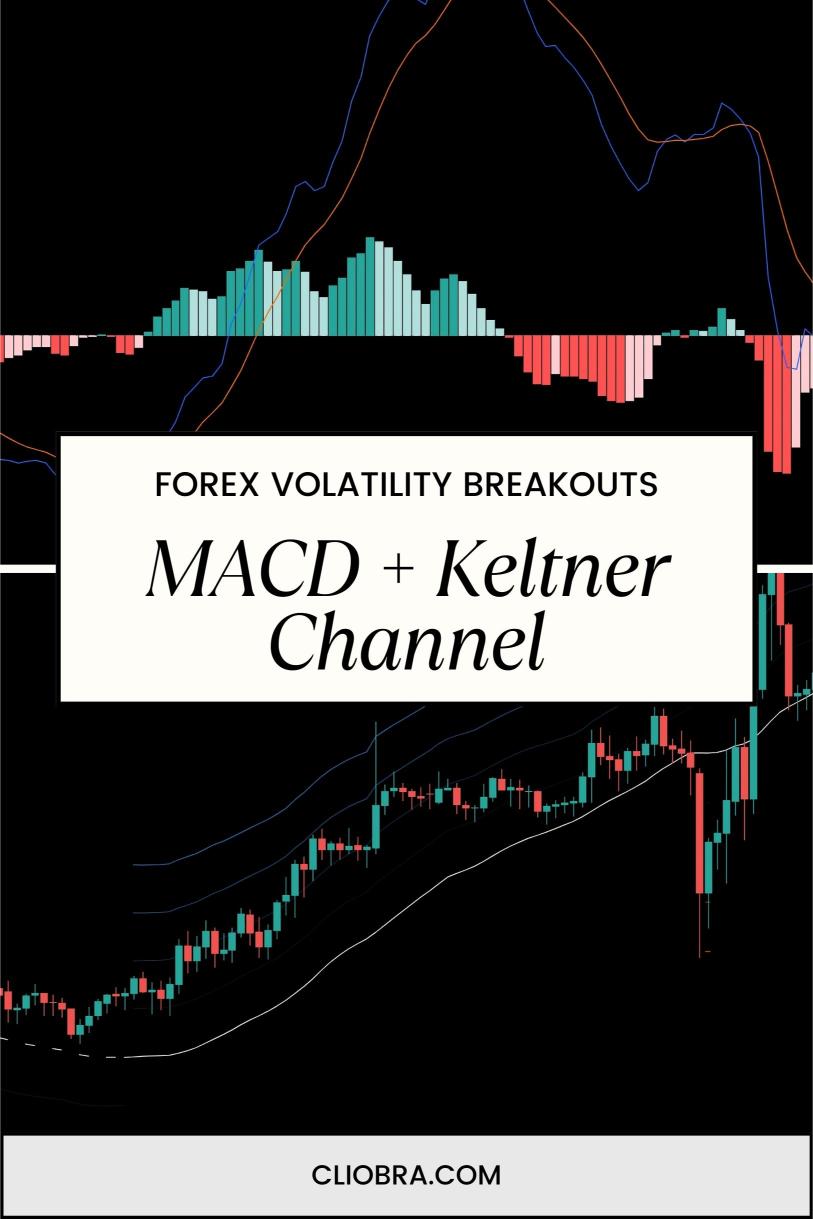
But I’ve discovered a powerful duo that can help you navigate these turbulent waters: the MACD and the Keltner Channel.
Let’s dive into how you can leverage these tools for volatility breakouts.
Understanding the Basics
What is MACD?
The Moving Average Convergence Divergence (MACD) is a trend-following momentum indicator.
It shows the relationship between two moving averages of a security’s price.
- MACD Line: Difference between the 12-day and 26-day exponential moving averages (EMAs).
- Signal Line: 9-day EMA of the MACD Line.
- Histogram: Difference between the MACD Line and the Signal Line.
What is the Keltner Channel?
The Keltner Channel is a volatility-based envelope set above and below an EMA.
It helps identify potential breakouts and trends based on market volatility.
- Middle Line: Typically a 20-day EMA.
- Upper/Lower Bands: Calculated using the Average True Range (ATR).
Combining MACD and Keltner Channel
Using these two indicators together can enhance your trading strategy.
Here’s how:
- Identify Trend Direction:
- Look for MACD line crossovers.
- If the MACD crosses above the Signal Line, that’s a bullish signal.
- Conversely, a crossover below indicates a bearish trend.
- Measure Volatility:
- Check the Keltner Channels.
- When the price breaks above the upper band, it can signal a strong bullish move.
- A break below the lower band may indicate a bearish trend.
- Confirm the Breakout:
- Look for MACD momentum.
- If both indicators align (MACD bullish and price above the upper band), it’s a strong signal to enter.
- Set Your Stop-Loss:
- Always protect your capital.
- Place your stop-loss below the last swing low for a buy trade and above the last swing high for a sell trade.
Why This Strategy Works
Statistically, traders using a combined approach of indicators see substantial improvements in entry and exit timing.
Research shows that combining trend-following indicators with volatility measures can increase win rates by as much as 30%.
That’s massive.
My Trading Bots and Their Power
Now, here’s the kicker.
I’ve developed a portfolio of 16 sophisticated trading bots that utilize the MACD + Keltner Channel strategy, among others.
These bots are designed to trade across major currency pairs like EUR/USD, GBP/USD, USD/CHF, and USD/JPY.
Each pair has a unique set of 3-4 bots, internally diversified to minimize risks and maximize returns.
They’re built for long-term performance, targeting 200-350 pips.
Plus, I’ve backtested them for the past 20 years, and they perform excellently even under harsh market conditions.
The best part?
I’m offering this entire EA portfolio for FREE.
If you’re serious about trading, you gotta check it out. Head over to my trading bots portfolio and get started.
Choosing the Right Broker
To effectively use any trading strategy, you need a trustworthy broker.
Here’s what to look for:
- Tight Spreads: Keeps your trading costs low.
- Fast Execution: You want your trades to hit the market instantly.
- Good Customer Support: Essential when you need quick help.
I’ve tested several brokers and compiled a list of the most trusted Forex brokers that meet these criteria.
Check them out here: Best Forex Brokers.
Wrapping Up
Using the MACD + Keltner Channel for volatility breakouts is a game-changer.
It’s all about combining trend analysis with volatility measures for the best results.
With my 16 trading bots, you can automate this strategy and increase your chances of success.
Don’t forget to explore the best Forex brokers to ensure your trading experience is smooth and profitable.
Dive in, learn, and watch your trading journey transform.