Last Updated on March 21, 2025 by Arif Chowdhury
Ever felt like you’re staring at your charts, trying to decode the market’s next move but just can’t find the signal through the noise?
You’re not alone.
Many traders wrestle with this, especially when it comes to identifying high-probability trades.
The Fractal Indicator can be your secret weapon.
Let’s break it down in a way that’s easy to digest.
What Is the Fractal Indicator?
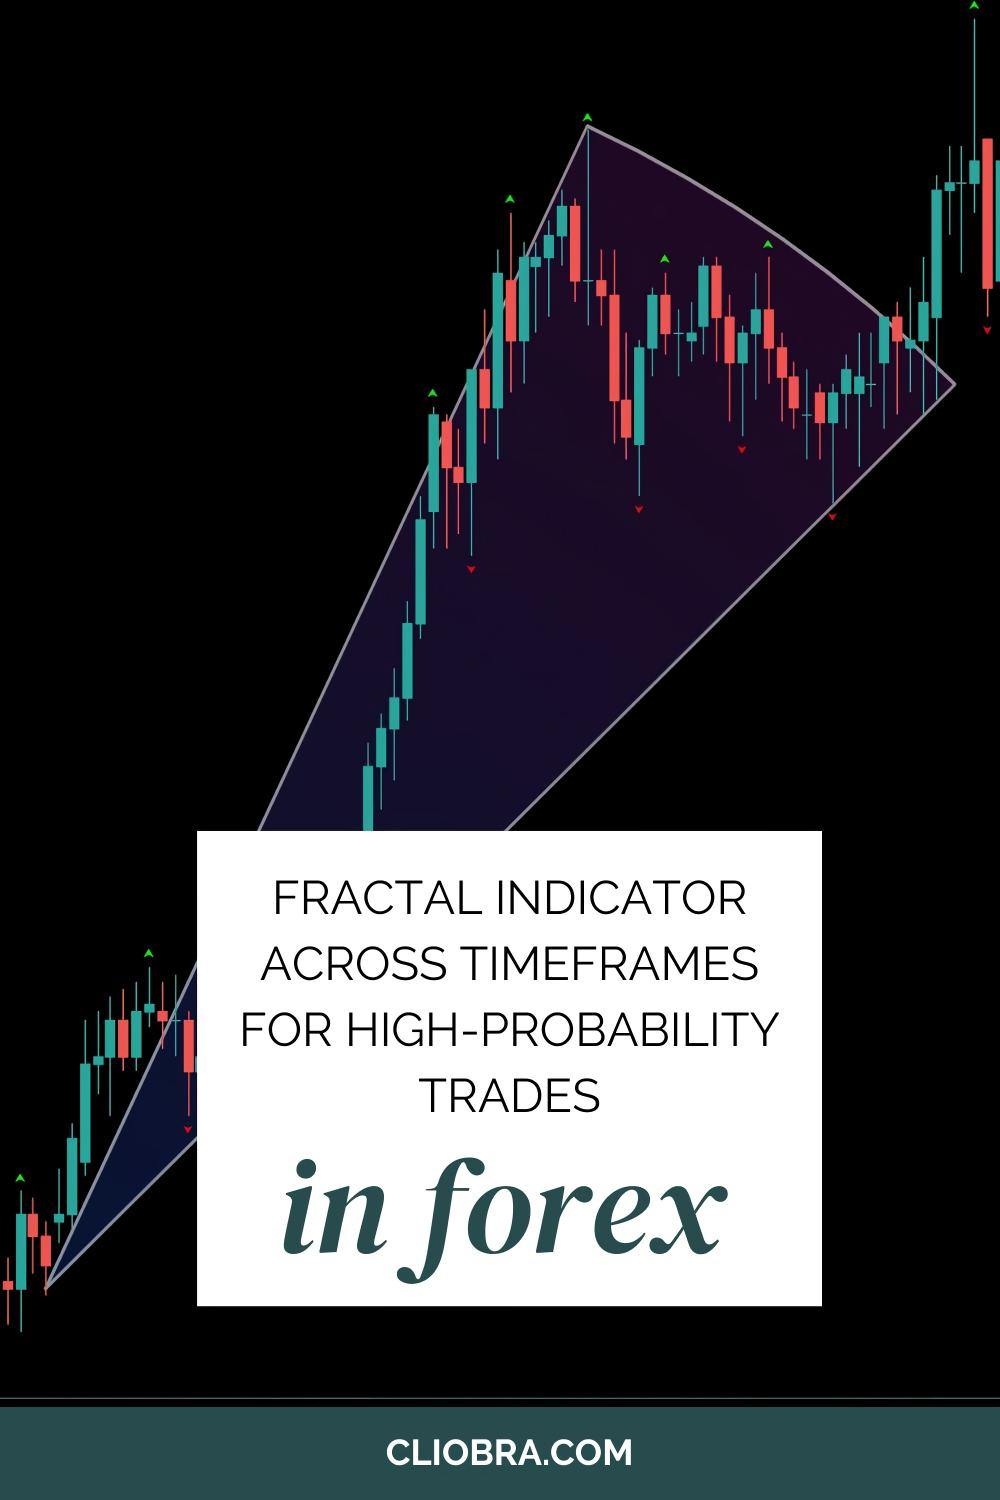
The Fractal Indicator is a powerful tool that helps traders identify potential reversals in the market.
It shows you the highest high and the lowest low over a specific number of bars.
You can think of it as a roadmap guiding you to potential entry and exit points.
But here’s the kicker: it works across different timeframes.
Why Use Fractals Across Timeframes?
Using fractals on multiple timeframes can give you a clearer picture of market movements.
Here’s why:
- Identify Trends: A fractal on a daily chart may indicate a long-term trend, while one on an hourly chart pinpoints short-term opportunities.
- Higher Probability Signals: When fractals align across timeframes, it can lead to higher-probability trades. For instance, if you spot a bullish fractal on a daily chart and a corresponding bullish fractal on an hourly chart, that’s your signal!
- Risk Management: By understanding where fractals appear on different timeframes, you can better manage your risk.
How to Use the Fractal Indicator: Step-by-Step
Let’s dive into how you can effectively use the Fractal Indicator across timeframes.
Step 1: Set Up Your Charts
Start with your preferred trading platform and set up multiple charts for the same currency pair across different timeframes.
For instance, you can have:
- Daily Chart: For identifying the overall trend.
- 4-Hour Chart: For spotting entry points.
- Hourly Chart: For fine-tuning your entries.
Step 2: Add the Fractal Indicator
Most platforms have a built-in Fractal Indicator.
Add it to each chart.
Step 3: Analyze the Signals
Look for fractals forming:
- Bullish Fractals: Indicate potential buying opportunities.
- Bearish Fractals: Suggest selling points.
Step 4: Confirm with Other Indicators
Don’t rely solely on fractals. Use other technical indicators like:
- Moving Averages: To confirm the trend direction.
- RSI: To check for overbought or oversold conditions.
Step 5: Execute Your Trade
When you see a fractal signal that aligns with the overall trend and is confirmed by other indicators, it’s time to execute your trade.
My Trading Bots and Fractals
As a seasoned Forex trader since 2015, I’ve developed a robust portfolio of 16 trading algorithms that leverage various strategies, including the Fractal Indicator.
These bots are specifically designed to trade on the H4 charts, aiming for longer-term gains of 200-350 pips.
What’s cool is that they’re not just focused on one currency pair; they work across the EUR/USD, GBP/USD, USD/CHF, and USD/JPY.
This multi-layered diversification minimizes correlated losses, allowing for a more stable trading experience.
And here’s the best part: I’m offering this entire EA portfolio for FREE!
You can check it out here.
Best Practices for Using Fractals
- Avoid Overtrading: Just because a fractal appears doesn’t mean you should trade it. Patience is key.
- Stay Updated on Market News: Economic events can affect price movements, so be aware of the calendar.
- Use Stop-Loss Orders: Protect your capital by placing stop-loss orders based on fractal levels.
Final Thoughts on Fractals and Brokers
In the world of Forex, having the right tools is crucial.
Using the Fractal Indicator across timeframes can enhance your trading strategy significantly.
Remember, it’s not just about finding signals; it’s about crafting a strategy that works for you.
And if you’re looking for reliable brokers to implement your strategies, check out the best Forex brokers I’ve tested here.
Start turning those fractals into profits!