Last Updated on April 1, 2025 by Arif Chowdhury
If you’ve ever asked yourself, “How do I predict where the market’s heading?” or, “Why do my trades seem like guesses?” — you’re not alone.
Most traders start off staring at charts, overwhelmed by candlesticks, moving averages, and confusing terms like RSI or Fibonacci retracements.
I’ve been there too. Back in 2015, I was throwing trades at the wall to see what stuck. Spoiler: not much did.
But once I mastered technical analysis, the game changed. Let me break it down for you in a way that actually makes sense.
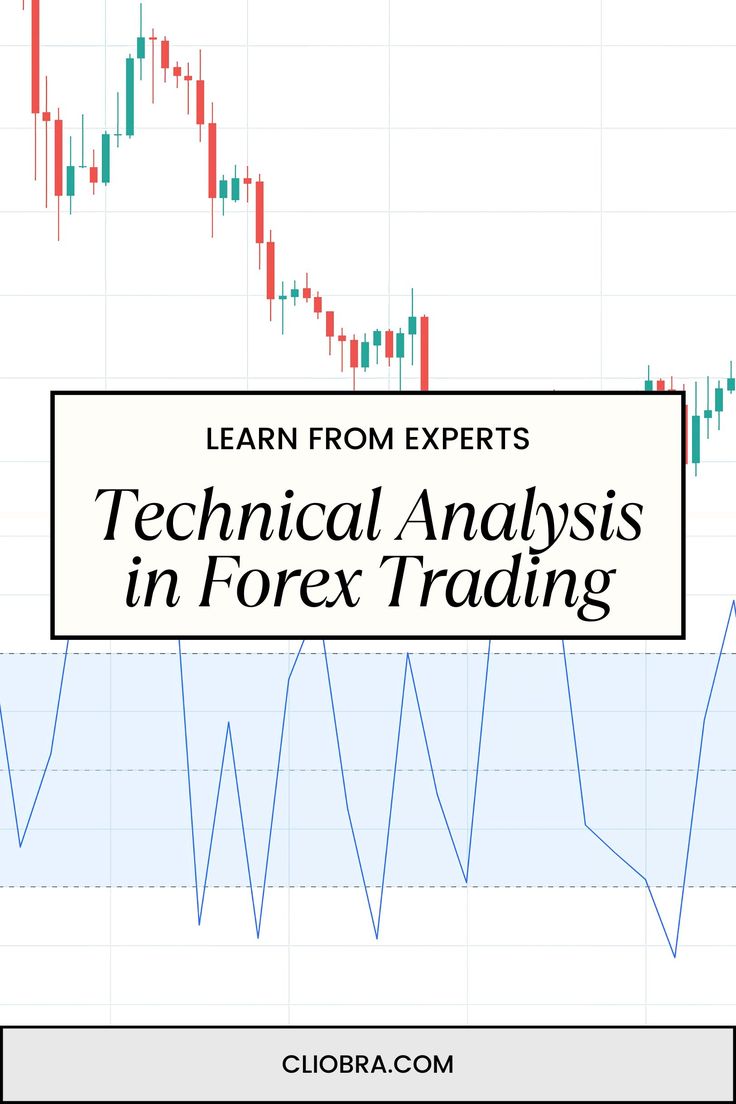
What is Technical Analysis in Forex Trading?
At its core, technical analysis is like reading the market’s mood.
Instead of relying on economic news or financial reports, you’re analyzing price movements, patterns, and indicators to make smarter trading decisions.
Think of it this way: the charts are a story. Technical analysis helps you decode it.
Why Use Technical Analysis?
Here’s the deal:
- Forex markets are massive — $7.5 trillion trades daily (as of 2022). Patterns emerge because so many traders act on similar signals.
- Technical analysis gives you a framework. Instead of reacting emotionally, you trade strategically.
- It’s data-driven. You’re not making decisions based on guesses but on patterns that have played out time and time again.
Getting Started: Key Tools and Indicators
You don’t need to learn every indicator out there. Stick with the essentials.
1. Support and Resistance Levels
Think of these as the market’s natural barriers.
- Support: A price level where demand is strong enough to prevent it from falling further.
- Resistance: A level where selling pressure stops the price from rising.
Quick tip: Draw these zones on your chart to see where price might bounce or reverse.
2. Moving Averages (MAs)
These smooth out price data to identify trends.
- Simple Moving Average (SMA): Average price over a set period.
- Exponential Moving Average (EMA): Puts more weight on recent data.
I’ve found the 50-day EMA works wonders for spotting short-term trends.
3. Relative Strength Index (RSI)
The RSI tells you if a currency is overbought or oversold. It’s a scale from 0-100.
- Above 70? Likely overbought — time to consider selling.
- Below 30? Oversold — think about buying.
4. Candlestick Patterns
These are like mood swings in the market.
Some classics to watch for:
- Doji: Indicates indecision.
- Engulfing Candle: A strong reversal signal.
- Hammer: Bullish signal after a downtrend.
5. Fibonacci Retracements
This one sounds fancy but stick with me.
It’s based on math ratios (0.382, 0.5, 0.618, etc.) that highlight potential reversal points. Plot it from a recent high to low, and voila — you get zones to watch for bounces.
How I Combine These Tools to Dominate Forex
Back in the day, I’d throw every indicator on my chart. It was a mess.
Now, I keep it simple:
- Identify the trend using moving averages.
- Spot support/resistance zones for entry and exit points.
- Use RSI or candlestick patterns to confirm the trade.
- Overlay Fibonacci retracements to double-check high-probability areas.
For example, let’s say EUR/USD is trending upward. Price pulls back to a key support zone, RSI dips below 30, and there’s a hammer candlestick. That’s my signal to enter.
Mistakes to Avoid
Here’s where most traders screw up:
- Overcomplicating charts. Don’t use 16 indicators at once. Less is more.
- Ignoring risk management. Never risk more than 2% of your account on a trade.
- Trading without a plan. Know your entry, exit, and stop-loss before you click buy.
A Secret Weapon: My Trading Bots
Let me let you in on something that skyrocketed my results.
I’ve developed 16 specialized trading bots that work across EUR/USD, GBP/USD, USD/CHF, and USD/JPY.
Each bot has a unique strategy tailored to that currency pair. They’re diversified to minimize risk — so when one bot has an off day, the others keep churning out profits.
They’re designed to follow the same principles I’ve laid out above, but they’re lightning-fast and emotion-free. That’s the real edge.
🚀Gain 2-5% daily ROI – Get this EA for FREE!
If you’re curious, I share insights about these bots regularly. Just ask — I’m always happy to share what’s working for me.
Why the Right Broker Matters
Your strategy is only as good as your broker.
Slippage, high spreads, or unreliable platforms can wreck even the best trades.
I’ve tested countless brokers since 2015, and the difference between a great broker and an average one is night and day.
If you’re looking for a solid recommendation, I’ve got a shortlist of trusted brokers that consistently deliver.
Final Words of Wisdom
Technical analysis isn’t a crystal ball.
It’s a toolkit.
The more you practice, the better you’ll get at spotting patterns, predicting moves, and making smarter trades.
And hey, if you’re not quite ready to dive in solo, my bots and broker recommendations are here to help.
At the end of the day, it’s about finding what works for you and sticking with it.
