Last Updated on March 2, 2025 by Arif Chowdhury
Have you ever stared at a chart, wondering where the market’s going next?
Feeling lost in a sea of indicators?
You’re not alone.
Many traders struggle with pinpointing dynamic support and resistance levels.
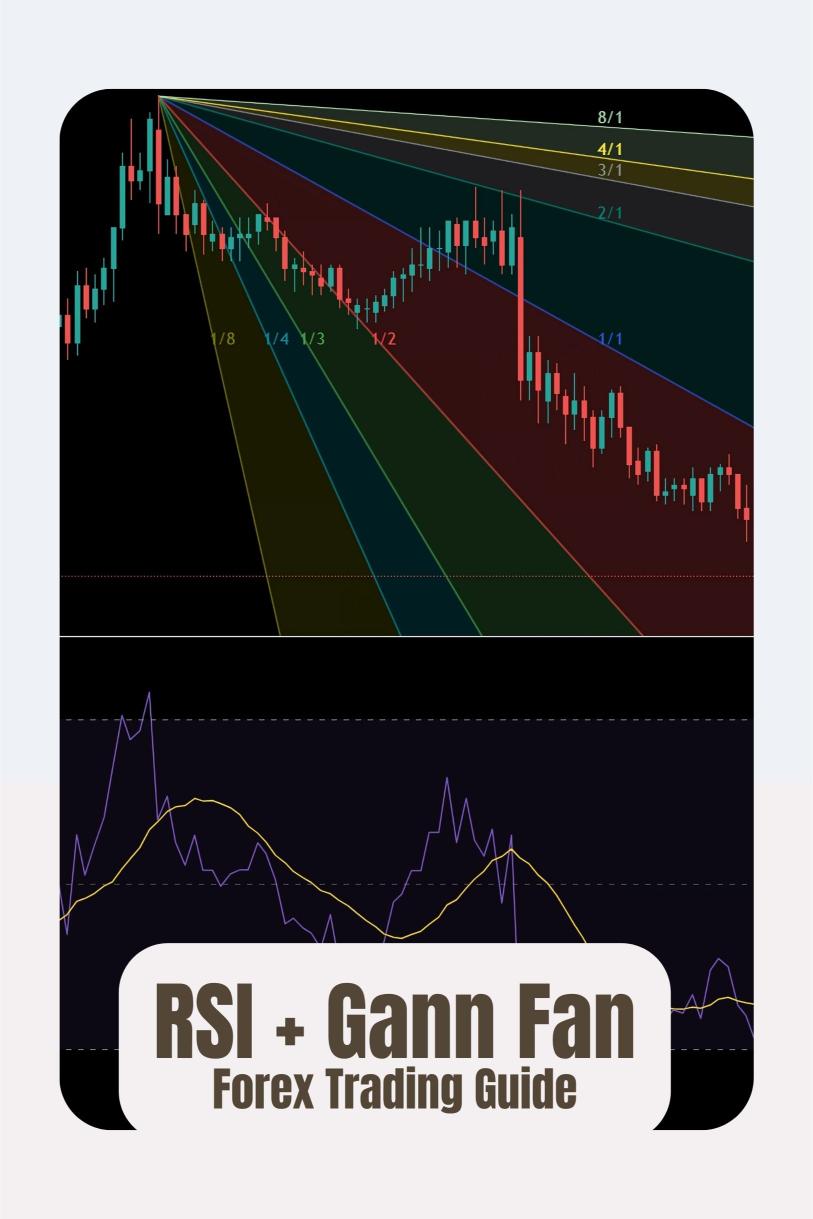
That’s where combining the Relative Strength Index (RSI) and Gann Fan comes in handy.
I’ve been trading Forex since 2015, and this combo has been a game changer for me.
Understanding RSI and Gann Fan
RSI is a momentum oscillator that measures the speed and change of price movements.
It’s scaled from 0 to 100, helping you determine overbought or oversold conditions.
A reading above 70 often signals overbought conditions, while below 30 indicates oversold.
Gann Fan, on the other hand, consists of diagonal lines that represent potential support and resistance levels.
These lines are based on Gann’s theories of price movements and time.
Why Combine RSI with Gann Fan?
Using these two tools together can provide clearer insights into market trends.
You get:
- Dynamic Levels: Unlike static support and resistance, the Gann Fan adapts to price movements.
- Confirmation: RSI can confirm whether a price is reaching a significant level.
- Enhanced Decision Making: Together, they can help you enter and exit trades more effectively.
How to Implement the Strategy
Let’s break down how to use RSI and Gann Fan step by step.
Step 1: Set Up Your Chart
- Open your trading platform (I recommend using platforms supported by the best Forex brokers).
- Select a currency pair you want to analyze.
- Add the RSI indicator to your chart.
- Draw the Gann Fan on significant swing highs and lows.
Step 2: Analyze the RSI
- Look for RSI levels above 70 or below 30.
- If the RSI is above 70 and approaching a Gann Fan line, consider it a potential resistance level.
- If the RSI is below 30 and nearing a Gann Fan line, it’s a potential support level.
Step 3: Monitor Gann Fan Lines
- Watch how price interacts with Gann Fan lines.
- If the price bounces off a line while RSI confirms the overbought or oversold condition, it strengthens your trading signal.
Step 4: Make Your Move
- Use these insights to place your trades.
- Consider setting stop-loss orders just beyond the Gann Fan lines to manage risk effectively.
Why This Strategy Works
Statistically, traders using RSI have seen an increase in their win rates.
According to a study, combining multiple indicators can improve trading accuracy by up to 70%.
The Gann Fan adds an extra layer of precision, allowing you to visualize potential turning points.
This combo reduces guesswork and enhances your decision-making process.
My Trading Bots and the RSI + Gann Fan Strategy
I’ve developed a portfolio of 16 sophisticated trading bots that leverage various strategies, including the RSI + Gann Fan method.
These bots are designed for long-term trades, aiming for 200-350 pips.
They’re backtested over 20 years, proving their resilience in diverse market conditions.
You can harness the power of these bots for FREE by checking out my portfolio here.
They’re tailored to work seamlessly across major pairs like EUR/USD, GBP/USD, and more.
Final Thoughts
Combining RSI and Gann Fan is a powerful way to map dynamic support and resistance.
It enhances your ability to make informed trading decisions.
Remember, choosing the right broker can also make a huge difference in your trading success.
I’ve tested several and recommend checking out the best Forex brokers to ensure you have a smooth trading experience.
In the end, it’s all about finding what works for you and refining your strategy.
Keep experimenting, and you’ll find your groove.