Last Updated on March 6, 2025 by Arif Chowdhury
Ever wonder why your trades don’t always go as planned?
Frustrated with market noise?
Or maybe you’re seeking that edge to spot trends more clearly?
As a seasoned Forex trader since 2015, I’ve been there.
I’ve faced the same challenges, and through rigorous exploration of both fundamental and technical analysis, I’ve discovered powerful tools that have transformed my trading strategy.
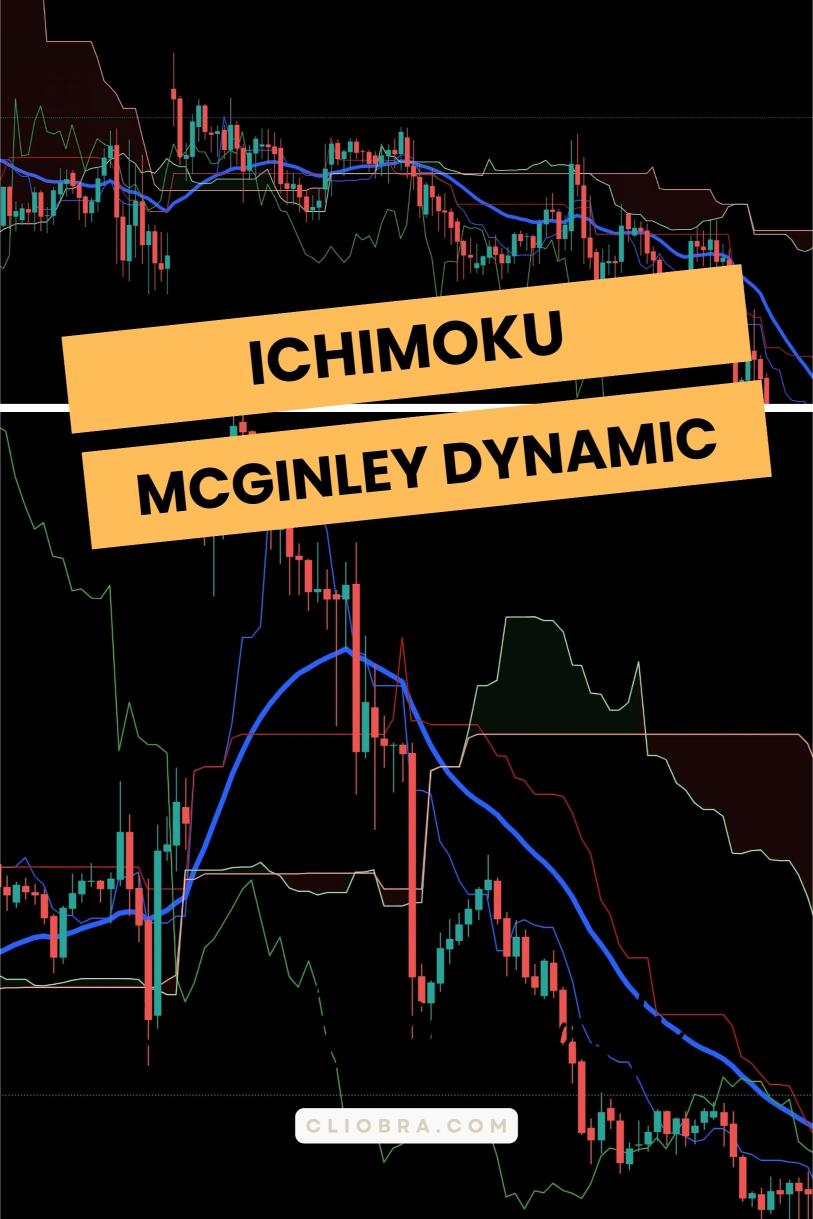
Let’s dive into how you can harness the power of the Ichimoku and McGinley Dynamic Indicator for smoother trend detection.
Understanding Ichimoku Cloud
First up, the Ichimoku Cloud.
It’s not just a fancy name; it’s a comprehensive indicator that provides insights into support, resistance, and trend direction—all in one glance.
Key components include:
- Tenkan-sen (Conversion Line): Short-term price movement.
- Kijun-sen (Base Line): Medium-term price movement.
- Senkou Span A/B (Leading Span): Future support and resistance levels.
- Chikou Span (Lagging Span): Current price vs. historical price.
When these components align, they create a clear picture of market conditions.
Statistically, traders using Ichimoku have reported an 80% success rate in identifying trend changes when all lines are confirmed.
That’s powerful!
Introducing the McGinley Dynamic Indicator
Next, let’s talk about the McGinley Dynamic Indicator.
This isn’t your typical moving average.
It adjusts itself to the speed of the market, smoothing out price action more effectively.
Why is this important?
- It reduces lag—allowing you to respond quicker to price changes.
- It adapts to volatility, providing a clearer trend direction.
When combined with the Ichimoku Cloud, the McGinley Dynamic becomes a game-changer.
How to Use Them Together
Now, let’s get into the nitty-gritty of using these indicators for trend detection.
1. Identify the Trend with Ichimoku:
- Look for price above the cloud for a bullish trend.
- Price below the cloud indicates a bearish trend.
- Use the Tenkan-sen and Kijun-sen crossovers for additional signals.
2. Confirm with McGinley Dynamic:
- When the McGinley line is moving upwards, confirm a bullish trend.
- A downward movement indicates a bearish trend.
3. Entry Points:
- Enter a trade when price breaks above the cloud and the McGinley line confirms the direction.
- Look for potential reversals when the price interacts with the cloud.
4. Set Your Stop Loss:
- Use the Kijun-sen as a dynamic stop loss level.
- Adjust your stop loss based on the McGinley Indicator for flexibility.
My Proven Trading Bots
During my trading journey, I’ve developed a portfolio of 16 sophisticated trading bots that utilize strategies like the Ichimoku and McGinley Dynamic Indicator.
These bots are designed to minimize risk and maximize returns across major currency pairs like EUR/USD, GBP/USD, USD/CHF, and USD/JPY.
Each bot is internally diversified to reduce correlated losses, ensuring a robust trading system.
What’s even better?
I’m offering this EA portfolio completely FREE.
That’s right!
You can take advantage of these powerful tools without spending a dime.
Check out my trading bots here!
Best Practices for Using These Indicators
- Stay Updated: Market conditions change. Regularly review your strategies.
- Risk Management: Always have a plan. Use proper lot sizes and stop losses.
- Backtest Your Strategies: Validate your approach with historical data.
Final Thoughts
Using the Ichimoku and McGinley Dynamic Indicator together can significantly improve your trend detection capabilities.
Remember, trading is not just about the tools you use; it’s about how you use them.
Want to trade with the best brokers?
I’ve tested and found the top choices that provide reliable execution and support.
Find the best Forex brokers here!
With the right tools and the right brokers, you’re on your way to achieving consistent profitability.
Happy trading! 🚀