Last Updated on March 2, 2025 by Arif Chowdhury
Ever sat in front of your screen, scratching your head, wondering how to find the perfect trade setup?
As a seasoned Forex trader since 2015, I’ve faced the same dilemma.
I’ve dived deep into both fundamental and technical analysis.
But today, let’s focus on one powerful tool: Bollinger Bands.
These bands can transform your trading game if you know how to use them right.
What Are Bollinger Bands?
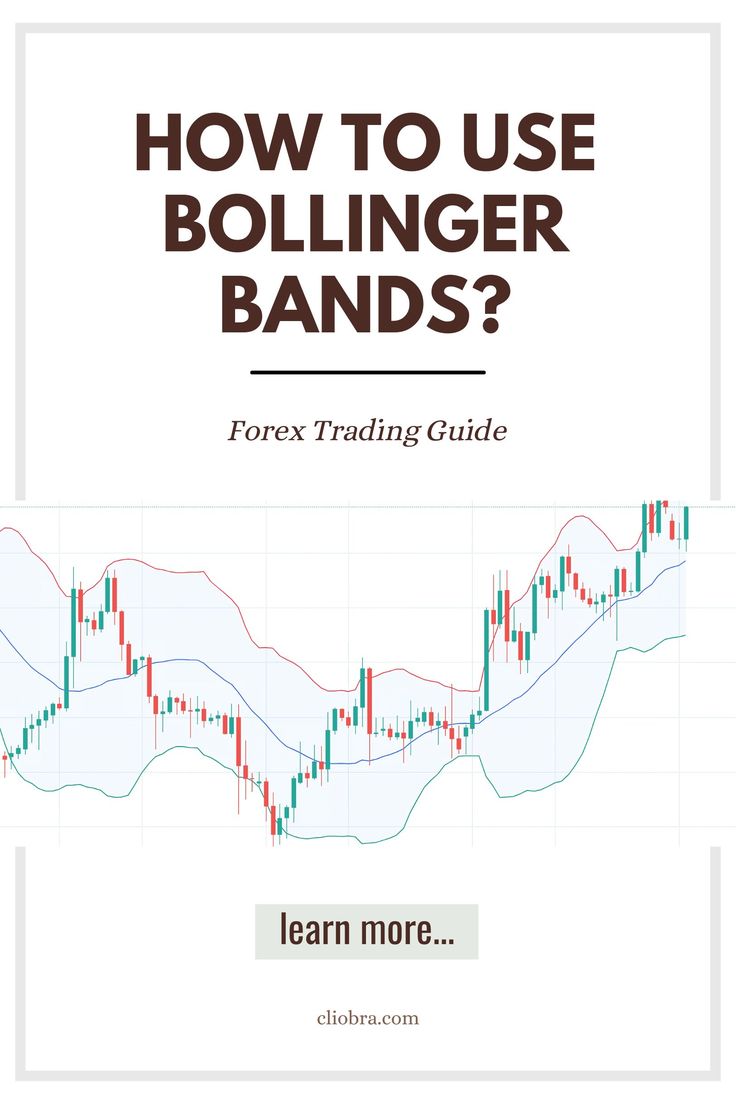
Bollinger Bands consist of three lines:
- Middle Band: This is the simple moving average (SMA).
- Upper Band: This is the SMA plus a set number of standard deviations.
- Lower Band: This is the SMA minus a set number of standard deviations.
These bands expand and contract based on market volatility.
When volatility increases, the bands widen.
When it decreases, the bands contract.
Why Use Bollinger Bands?
- Visual Clarity: They provide a clear visual of price action and volatility.
- Identify Overbought and Oversold Conditions: Prices touching the upper band may be overbought, while prices at the lower band might be oversold.
- Statistical Edge: About 90% of price action typically remains between the bands.
How to Spot Trade Setups
Now, let’s get practical. Here’s how I use Bollinger Bands in my trading.
1. Look for Squeeze Patterns 📉
A squeeze occurs when the bands come close together.
This indicates low volatility and often precedes significant price movement.
Action Step: Wait for the price to break out of the squeeze.
This could signal a new trend.
2. Identify Overbought/Oversold Conditions 📈
When prices touch the upper band, consider it a potential sell signal.
Conversely, touching the lower band could indicate a buy signal.
Action Step: Confirm with other indicators like RSI or MACD.
This helps avoid false signals.
3. Trend Following with Bollinger Bands 🏄♂️
When the price consistently bounces between the bands, it’s in a trend.
If the price is above the middle band, look for buying opportunities.
If it’s below, look for selling opportunities.
Action Step: Use the bands to set your stop-loss points.
For instance, place a stop just outside the opposite band.
Statistical Insights
Did you know that about 68% of price movements occur within one standard deviation of the SMA?
This is crucial for setting realistic profit targets.
Also, nearly 80% of price action stays between the bands during trending markets.
Understanding these stats can refine your entry and exit strategies.
Example Scenarios
Let’s say you spot a squeeze on the EUR/USD pair.
After monitoring for a few days, the price breaks the upper band.
You place a buy order and set your stop-loss right below the middle band.
A few days later, the price skyrockets.
You’ve just capitalized on a perfect setup!
Combining Bollinger Bands with My Trading Bots 🤖
While Bollinger Bands are a fantastic tool, they work even better when combined with a robust trading strategy.
That’s where my 16 trading bots come into play.
Each bot is designed for long-term trades on major currency pairs like EUR/USD, GBP/USD, USD/CHF, and USD/JPY.
They’re diversified to minimize risk and maximize profitability.
Using H4 charts, these bots are programmed to target 200-350 pips.
This long-term approach means they thrive under various market conditions.
🚀Get this Forex EA Portfolio for FREE from here.
If you’re serious about trading, check out the best Forex brokers I’ve tested and consider integrating some powerful trading bots into your strategy.
Final Thoughts
Bollinger Bands can be a game-changer in your trading toolkit.
By understanding how to spot squeeze patterns, identify overbought and oversold conditions, and follow trends, you can enhance your trading strategy.
Remember, it’s all about combining tools and strategies for the best results.
So, grab a cup of coffee, dive into your charts, and start experimenting with Bollinger Bands today!
