Last Updated on February 7, 2025 by Arif Chowdhury
Ever felt lost in the noise of Forex trading?
Wondering how the big players—institutions—make their moves?
I’ve been in this game since 2015, and trust me, understanding institutional footprints can change your trading game.
Let’s dig in.
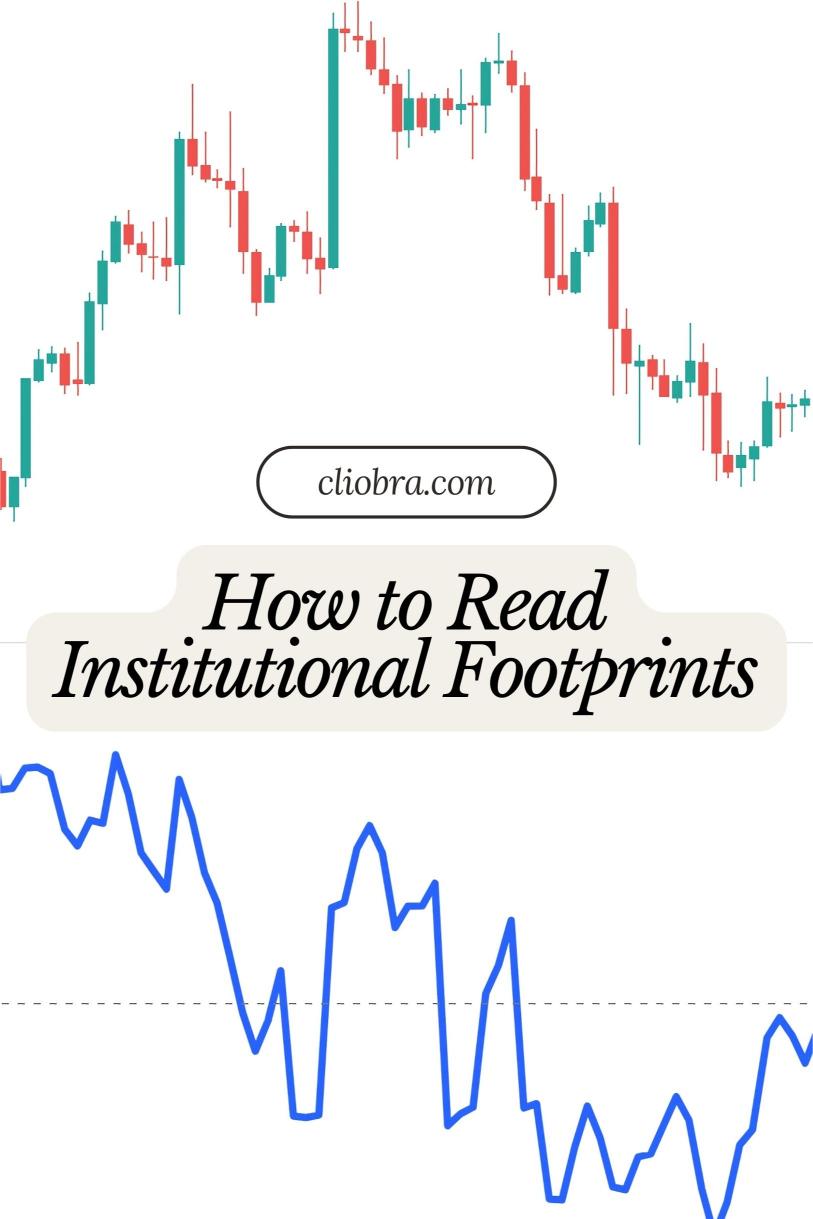
What Are Institutional Footprints?
Institutional footprints are the traces left behind by large traders or institutions in the Forex market.
These footprints give us insight into their buying and selling activities.
Think of it like reading the breadcrumbs they leave behind.
Why does this matter?
Because institutions have the capital and information that can move markets.
If you can read their footprints, you can align your trades with theirs.
How to Spot These Footprints
Here are some key methods to spot institutional footprints:
- Volume Analysis: High trading volumes often indicate institutional activity. When you see a spike in volume, pay attention.
- Price Action: Institutional traders often leave behind specific patterns in price movements. Look for strong bullish or bearish candles.
- Order Blocks: These are areas where institutions accumulated or distributed their positions. If price revisits these areas, it often reacts.
- Support and Resistance Levels: Institutions tend to trade around key support and resistance levels.
Statistical Insight
Did you know that around 80% of Forex trading volume comes from institutional players?
That’s a huge chunk!
Understanding their behavior can give you a significant edge.
Using Candlestick Patterns
Candlestick patterns can be a window into institutional activity.
Here are a few to watch for:
- Engulfing Candles: A strong bullish or bearish engulfing candle can indicate institutional buying or selling.
- Doji Candles: These can signal indecision but often precede significant movements when they occur at crucial levels.
- Pin Bars: A pin bar can indicate rejection of a price level, often due to institutional involvement.
The Power of News
Institutions react to news differently than retail traders.
They often have access to information before it becomes public.
Pay attention to economic news releases.
How does price react?
This can show you the institutional sentiment.
Real-World Example
Let me share a quick story.
A while back, I was watching the EUR/USD pair.
There was a spike in volume just before a significant news release.
The price shot up, then retraced.
I noticed an order block right where the price retraced.
I placed a trade aligning with the institutional footprint.
Guess what?
It hit my target of 250 pips.
That’s the power of reading institutional footprints.
Tools to Help You
Here’s a short list of tools I use to analyze institutional footprints:
- TradingView: Great for charting and volume analysis.
- MetaTrader 4/5: Excellent for backtesting your strategies.
- COT Reports: These show the positioning of commercial traders and can give insight into institutional sentiment.
Implementing What You Learn
Now, how do you apply this knowledge?
- Start by practicing on demo accounts.
- Use low-risk trades to test your strategies.
- Keep a trading journal. Document your findings about institutional footprints.
My Trading Journey
Through my journey, I developed 16 sophisticated trading bots that leverage these insights.
They’re designed to operate on H4 charts, targeting 200-350 pips.
This multi-layered diversification across major pairs like EUR/USD and GBP/USD has proven resilient.
If you’re serious about enhancing your trading, I encourage you to check out my trading bots portfolio.
Choosing the Right Broker
Don’t forget, having a reliable broker is crucial.
I’ve tested various brokers and can confidently recommend some top choices.
Check my list of the best Forex brokers to ensure you have a solid foundation for your trading.
Conclusion
Reading institutional footprints in Forex charts is a skill that can elevate your trading.
By analyzing volume, price action, and patterns, you can align with the market movers.
Remember, it’s all about observing and adapting.
Stay curious, keep learning, and you’ll see your trading improve.