Last Updated on April 1, 2025 by Arif Chowdhury
Ever felt like Forex charts are some cryptic code only Wall Street pros understand? You’re not alone.
Every beginner faces the same hurdle: How do I read Forex charts and actually make money?
I’ve been in this game since 2015. Built strategies, tested systems, and developed 16 rock-solid trading bots across EUR/USD, GBP/USD, USD/CHF, and USD/JPY.
Let’s break this down so that by the end of this, you’ll read Forex charts like a seasoned trader.
What Are Forex Charts? 🤔
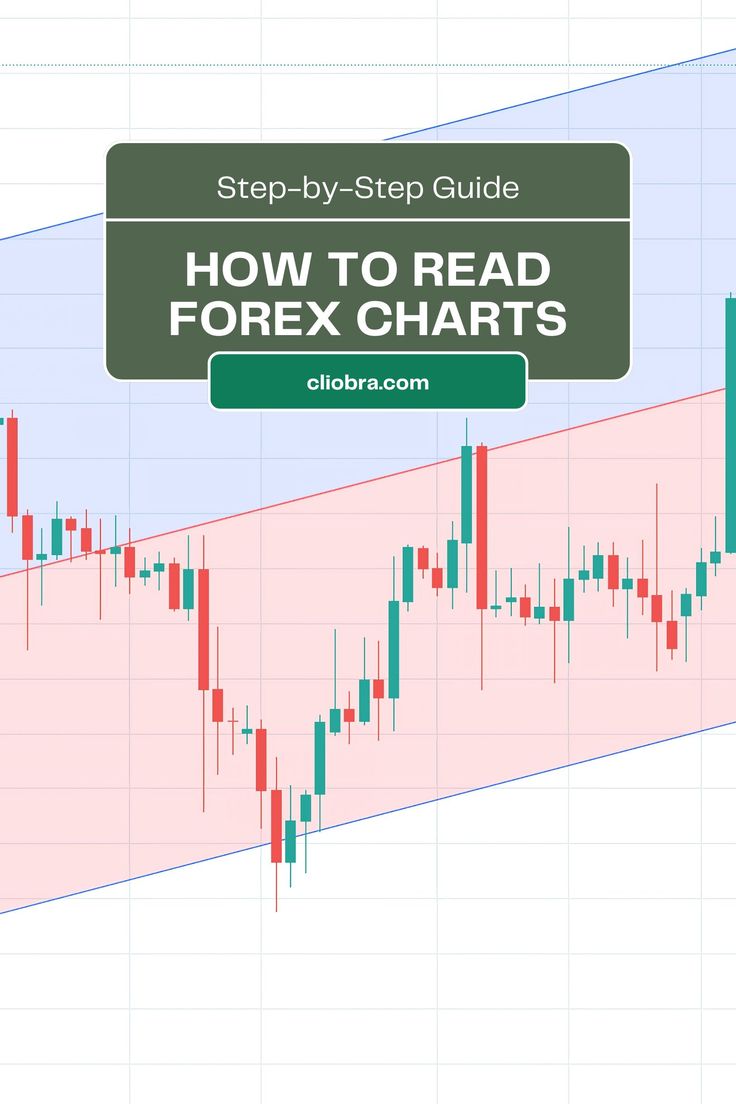
Forex charts are visual representations of price movements. They show how a currency pair moves over time.
Three main types exist:
- Line Charts – Simplest, connects closing prices. Great for spotting trends, but lacks detail.
- Bar Charts – Shows open, high, low, and close (OHLC). Gives more insight into price movement.
- Candlestick Charts – The gold standard. Same as bar charts but visually clearer.
If you’re serious about trading, candlestick charts are your best friend.
The Essential Components of a Forex Chart
Before diving deep, you need to know these basic elements:
1. Timeframes⏳
You can view charts in different timeframes – 1-minute, 15-minute, 1-hour, daily, weekly.
- Scalpers live on 1-minute and 5-minute charts.
- Day traders stick to 15-minute or 1-hour charts.
- Swing traders use daily and weekly charts.
Your trading style determines your timeframe.
2. Currency Pairs 💱
Each chart represents a currency pair like EUR/USD or GBP/JPY.
- Major pairs – Most traded (EUR/USD, GBP/USD, etc.).
- Minor pairs – Less liquid but still active.
- Exotic pairs – High risk, high reward.
I personally focus on the majors – less slippage, tighter spreads.
3. Price Action & Trends 📈
Trends are everything in Forex trading. Three types exist:
- Uptrend – Higher highs, higher lows.
- Downtrend – Lower highs, lower lows.
- Sideways (Range) – Price moves between support & resistance.
Your goal? Ride trends and avoid choppy sideways markets.
How to Analyze Forex Charts Like a Pro
1. Identify Support & Resistance
These are price zones where markets historically reverse.
- Support – Floor where price bounces up.
- Resistance – Ceiling where price drops.
Mark these levels and use them to time entries & exits.
2. Spot Key Candlestick Patterns
Certain patterns scream “trend reversal” or “continuation.”
- Engulfing candles – Big momentum shift.
- Doji – Market indecision.
- Pin bars – Strong reversals.
Learn these, and you’ll start seeing setups everywhere.
3. Use Moving Averages for Confirmation
Moving averages smooth price action and show trends.
- 200 EMA – The big one. If price is above, it’s bullish; below, it’s bearish.
- 50 EMA – Medium-term trend guide.
- 20 EMA – Short-term trend speed.
Crossovers between EMAs can be solid trade signals.
4. Volume & Market Sentiment
Volume matters. More volume means stronger moves.
- High volume on breakouts = Trust the move.
- Low volume on breakouts = Likely fakeout.
Pair this with news events, and you get an edge.
The Secret Weapon: Automated Trading Bots 🤖
Here’s the truth: Even with all this knowledge, trading is hard.
Why? Emotions. Fatigue. Missed setups.
That’s why I built my 16 trading bots across EUR/USD, GBP/USD, USD/CHF, and USD/JPY. Each bot is internally diversified, ensuring no single bot wrecks your account.
🚀Gain 2-5% daily ROI – Get this EA for FREE!
They run 24/5, follow strict risk management, and execute trades based on proven strategies.
I still trade manually, but my bots handle the heavy lifting. If you’re tired of second-guessing trades, check them out.
Finding the Right Broker Matters
If you’re using a bad broker, you’re already losing.
I’ve tested countless Forex brokers over the years. Tight spreads, fast execution, and reliable withdrawals are non-negotiable.
If you’re looking for the best ones, I’ve put together a list of top Forex brokers I personally use and recommend.
Final Thoughts
Forex charts aren’t that complicated once you break them down.
- Start with candlestick charts.
- Identify trends, support & resistance.
- Use moving averages & volume to confirm.
- Consider automation (bots) for consistency.
- Trade with a broker that doesn’t screw you.
The more you practice, the clearer charts become. Stick with it, and soon, you’ll be reading them like a pro.
