Last Updated on February 12, 2025 by Arif Chowdhury
Ever wondered how some traders seem to have a sixth sense for market moves?
You’re not alone.
Many traders struggle with predicting price action, often feeling lost amidst the chaos of charts and indicators.
But what if I told you there’s a way to cut through the noise?
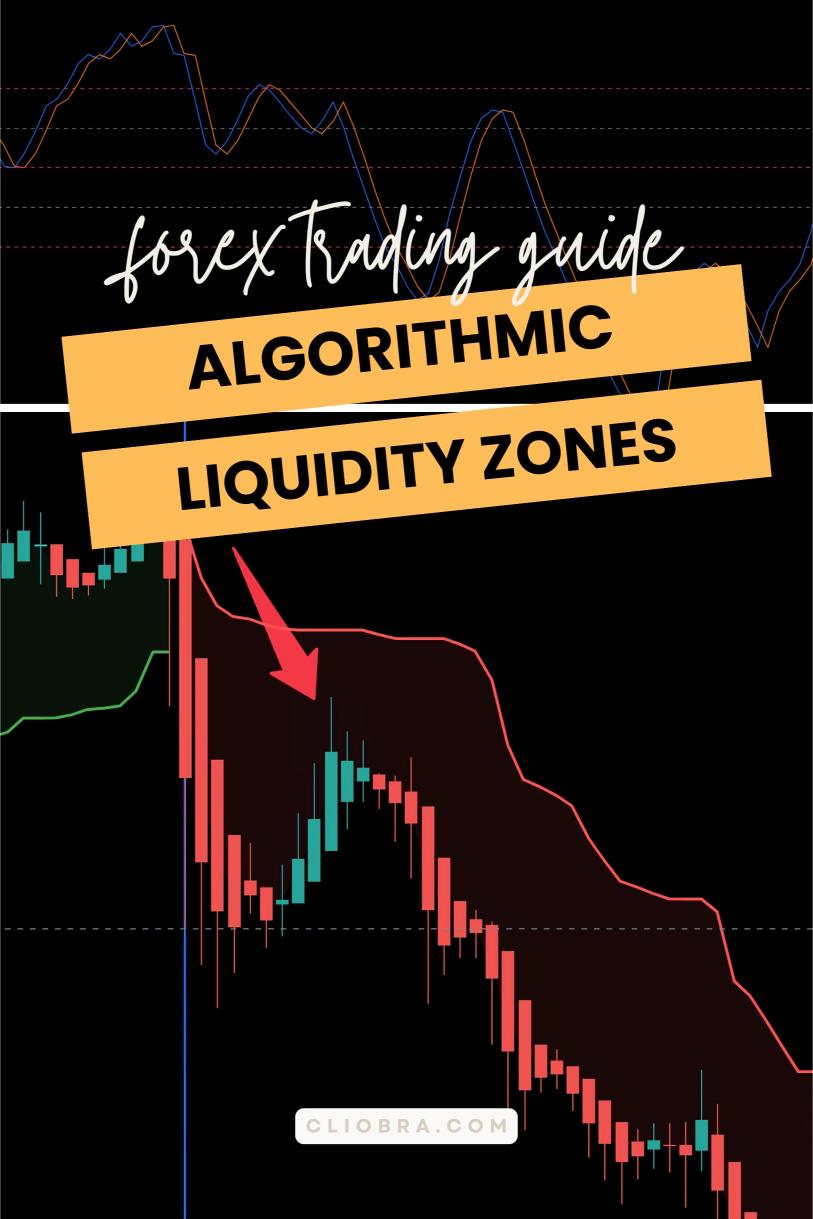
Welcome to the world of Algorithmic Liquidity Zones.
This approach can help you identify key areas where price is likely to react.
Let’s dive in.
What Are Algorithmic Liquidity Zones?
These zones are price levels where large orders are lurking.
This could be from institutional traders or major players in the market.
When price approaches these areas, the likelihood of a significant reaction increases.
Here’s what you need to know:
- Liquidity Zones are often found around round numbers or previous support/resistance levels.
- They can be identified using historical price action.
- Traders can use them to anticipate market moves, improving their entry and exit strategies.
Why It Works
Understanding market psychology is crucial.
Traders often make decisions based on where they think the price will go.
When many traders focus on the same zones, it creates a self-fulfilling prophecy.
Here are some stats that highlight the power of liquidity zones:
- Studies show that over 70% of market moves occur around these key levels.
- According to research, institutional traders account for about 80% of daily Forex volume, making their activity around liquidity zones critical.
Recognizing these patterns can enhance your trading edge.
How to Identify Liquidity Zones
Let’s break this down into simple steps:
- Look at Historical Levels:
Analyze previous highs and lows.
Pay special attention to areas where price has reversed multiple times. - Round Numbers:
Mark significant round numbers (like 1.2000 or 1.3000).
These levels often attract large orders. - Volume Analysis:
Check volume spikes.
Higher volume at certain levels indicates strong interest. - Use Technical Indicators:
Indicators like the Relative Strength Index (RSI) can help identify overbought or oversold conditions near liquidity zones. - Stay Patient:
Wait for confirmation signals like candlestick patterns before entering trades.
My Trading Strategy
Since 2015, I’ve honed my expertise in trading, especially with technical analysis.
I’ve developed a unique strategy that incorporates these liquidity zones.
But that’s not all.
I’ve created a portfolio of 16 sophisticated trading bots, each tailored for major currency pairs like EUR/USD and GBP/USD.
These bots are designed to trade long-term, targeting 200-350 pips, and they thrive under both stable and volatile market conditions.
🚀Get this Forex EA Portfolio for FREE from here.
Here’s how my bots can help you:
- Diversification: Each currency pair has 3-4 bots, minimizing correlated losses.
- Backtested: These bots have been tested over 20 years and perform excellently in harsh conditions.
- FREE Access: Yes, you can get this entire EA portfolio for free!
Want to take your trading to the next level? Check out my 16 trading bots and see the difference.
Putting It All Together
Now that you understand liquidity zones, it’s crucial to have the right tools.
Choosing a reliable broker enhances your trading experience.
Here are some of the best brokers I’ve tested:
- FBS: Tight spreads starting from 0.7 pips.
- XM: Zero fees and tight spreads as low as 0.8 pips.
- TickMill: Fast execution with spreads as low as 0.7 pips.
These brokers provide excellent support and trading conditions.
You can find the top brokers here: Most Trusted Forex Brokers.
Final Thoughts
Predicting market moves doesn’t have to be a guessing game.
By utilizing Algorithmic Liquidity Zones, you can align your trading strategy with market realities.
Combine this with robust trading tools like my EA portfolio and the right broker, and you’re setting yourself up for success.
Start making informed trading decisions today!
