Last Updated on February 24, 2025 by Arif Chowdhury
Ever felt stuck trying to figure out when a trend is about to flip?
You’re not alone.
As a seasoned Forex trader since 2015, I’ve been there too.
Let’s chat about how to identify those pivotal trend reversals using two powerful tools: Fibonacci retracements and the 200 EMA.
These methods aren’t just buzzwords; they’re game-changers in my trading strategy.
Understanding the Basics
First off, let’s break down these tools:
Fibonacci Retracements
This tool helps pinpoint potential reversal levels based on the Fibonacci sequence. It’s a way to gauge where price might bounce back after a pullback.
200 EMA (Exponential Moving Average)
This moving average smooths out price data over a period of time, giving you a clearer picture of the trend. When the price crosses the 200 EMA, it can signal a change in direction.
Why These Tools Matter
- Statistical Insight: Studies show that about 70% of price movements retrace before continuing in the original direction. This is where Fibonacci comes into play.
- Trend Confirmation: The 200 EMA is widely respected in the trading community. A price above the 200 EMA suggests a bullish trend, while below indicates bearish sentiment.
Spotting Reversals with Fibonacci
Here’s how I use Fibonacci to catch those reversals:
- Identify the Trend: Determine if you’re in an uptrend or downtrend.
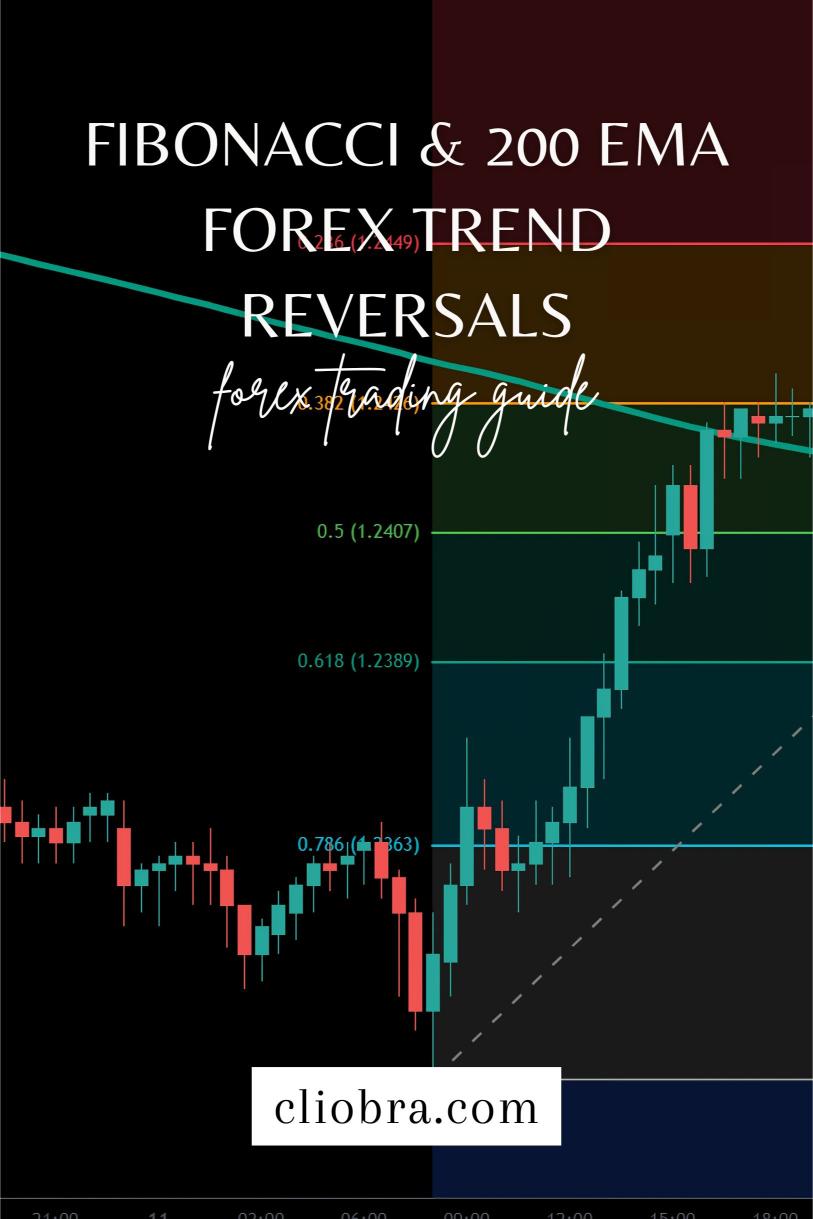
- Draw the Fibonacci Levels: Use the high and low points of the recent move to draw your Fibonacci retracement levels.
- Look for Confluence: Check for alignment with key levels like the 38.2%, 50%, or 61.8% retracement lines.
When price bounces off these levels, it’s often a strong signal that the trend might reverse.
Utilizing the 200 EMA
Now, let’s bring in the 200 EMA:
- Plot the 200 EMA on Your Chart: This will help you visualize the overall trend.
- Watch for Crossovers: A price crossover above the 200 EMA can indicate a bullish reversal, while a crossover below may signal a bearish shift.
Combining Both Tools for Precision
Here’s the magic: when Fibonacci levels align with the 200 EMA, you’ve got a powerful setup.
- Example Scenario: If the price hits the 61.8% Fibonacci level and is also approaching the 200 EMA, it’s worth considering a trade.
My Proven Strategy
Since I started trading, I developed a strategy that combines these tools with diversification. I’ve created a portfolio of 16 sophisticated trading bots that leverage the Fibonacci and 200 EMA strategy, among others.
These bots focus on major currency pairs like EUR/USD, GBP/USD, USD/CHF, and USD/JPY.
Why does this matter?
Each bot is designed to trade for long-term gains, targeting 200–350 pips. Plus, they minimize correlated losses through internal diversification.
Statistically, my backtesting over the past 20 years shows they perform excellently, even in tough market conditions.
And the best part? You can access this entire EA portfolio for FREE!
Check it out here: Discover My Trading Bots.
Best Practices for Trend Reversal Trading
- Stay Informed: Keep an eye on economic news that can impact currency prices.
- Use Risk Management: Always set stop-loss orders to protect your capital.
- Practice Patience: Wait for confirmation before jumping into trades.
Choosing the Right Broker
If you’re serious about forex trading, you need a reliable broker.
I’ve tested several and recommend starting with the best.
Check out these brokers for a superior trading experience: Most Trusted Forex Brokers.
Conclusion
Identifying trend reversals using Fibonacci and the 200 EMA isn’t just a theory—it’s a practical approach that has worked wonders for me.
The combination of these tools can enhance your trading strategy significantly.
Remember, the journey of trading is all about learning and adapting.
With the right tools, a solid strategy, and a bit of patience, you’ll be on your way to spotting those trend reversals like a pro!