Last Updated on February 23, 2025 by Arif Chowdhury
Have you ever jumped into a trade only to watch it reverse right after you hit “buy”?
Frustrating, right?
You’re not alone.
Many traders struggle with fake breakouts, where price seems to surge past support or resistance, only to reverse quickly.
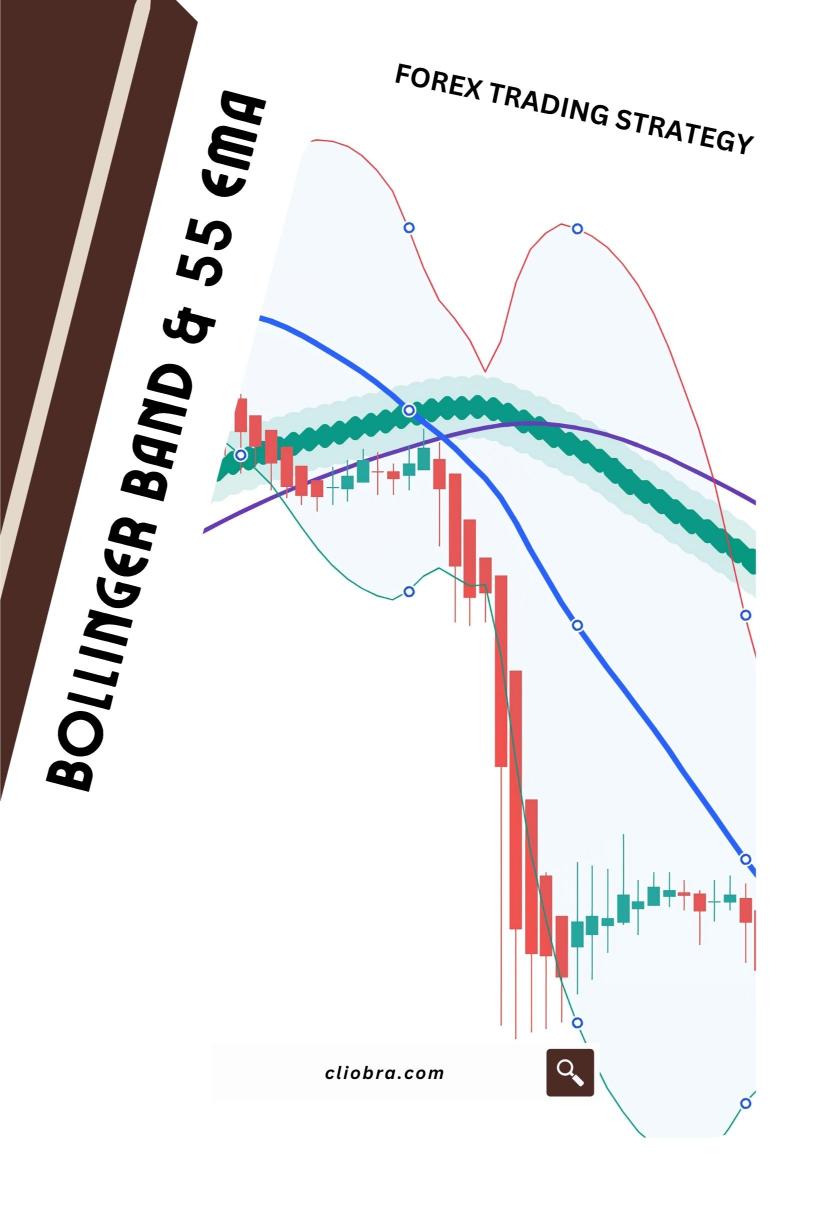
Today, I’m going to share how to pinpoint these traps using the Bollinger Bands and the 55 EMA.
Let’s dive in!
What Are Fake Breakouts?
Fake breakouts occur when the price moves outside a support or resistance level but fails to maintain that momentum.
Instead, it pulls back, leaving traders who entered the market feeling burned.
Did you know that around 70% of breakouts turn out to be false?
This is why understanding how to identify them is crucial for your trading success.
Using Bollinger Bands
Bollinger Bands are a powerful tool that can help you visualize market volatility and potential breakouts.
Here’s how they work:
- Middle Band: This is the 20-period simple moving average (SMA).
- Upper & Lower Bands: These are set two standard deviations away from the middle band.
When the price touches the upper band, it may indicate an overbought condition, while touching the lower band suggests an oversold condition.
How to Spot Fake Breakouts with Bollinger Bands:
- Look for Band Squeeze: A squeeze indicates low volatility and a potential breakout.
- Watch for Breakouts: When the price breaks above the upper band or below the lower band, it might signal a new trend.
- Confirm with Volume: Fake breakouts often have low volume. If the breakout happens with low volume, be cautious.
- Check for Reversal: If the price quickly returns within the bands after a breakout, it’s likely a fake.
The Role of the 55 EMA
The 55 EMA (Exponential Moving Average) adds another layer to your analysis.
It helps smooth out price action and highlights the overall trend.
Here’s how to leverage the 55 EMA effectively:
- Trend Direction: If the price is above the 55 EMA, you might consider bullish trades. If below, look for bearish opportunities.
- Dynamic Support/Resistance: The 55 EMA can act as a dynamic support or resistance level.
Combining Bollinger Bands with the 55 EMA:
- Wait for Confirmation: After a breakout, check if the price closes above the 55 EMA. If it doesn’t, you might be looking at a fake.
- Look for Divergence: If the price makes a new high but the 55 EMA doesn’t confirm, it’s a potential warning sign.
- Use in Conjunction: If the price breaks the upper Bollinger Band but fails to stay above the 55 EMA, it’s likely a false breakout.
My Trading Bots and Their Strategy
As a seasoned Forex trader, I’ve developed a portfolio of 16 sophisticated trading bots that utilize various strategies, including the Bollinger Band and 55 EMA.
These bots are designed to trade the major currency pairs:
- EUR/USD
- GBP/USD
- USD/CHF
- USD/JPY
Each bot is diversified to minimize risk while maximizing returns.
This means you get a robust trading system that can adapt to different market conditions.
What’s more?
I’m offering this EA portfolio for FREE!
All you need is to deposit a minimum of $500 with one of the best Forex brokers I’ve tested, and I’ll set you up with these powerful tools.
Check out my trading bots here.
Final Thoughts: Avoiding the Fake Breakout Trap
Identifying fake breakouts is essential in Forex trading.
By combining the insights from Bollinger Bands and the 55 EMA, you’ll be better equipped to make informed trading decisions.
Remember, trading is about risk management and strategy.
Having a reliable system in place can significantly enhance your profitability.
If you’re looking for a trustworthy broker to implement these strategies, I recommend checking out the best Forex brokers here.
They’ve been vetted and tested for your peace of mind.