Last Updated on February 22, 2025 by Arif Chowdhury
Ever sit down to trade and feel overwhelmed by the sheer amount of indicators out there?
You’re not alone.
Many traders struggle with finding that perfect combo that gives them the edge in the market.
That’s where the MACD Histogram and the 50 EMA come into play.
Let’s dive into how combining these two powerful tools can enhance your trading strategy.
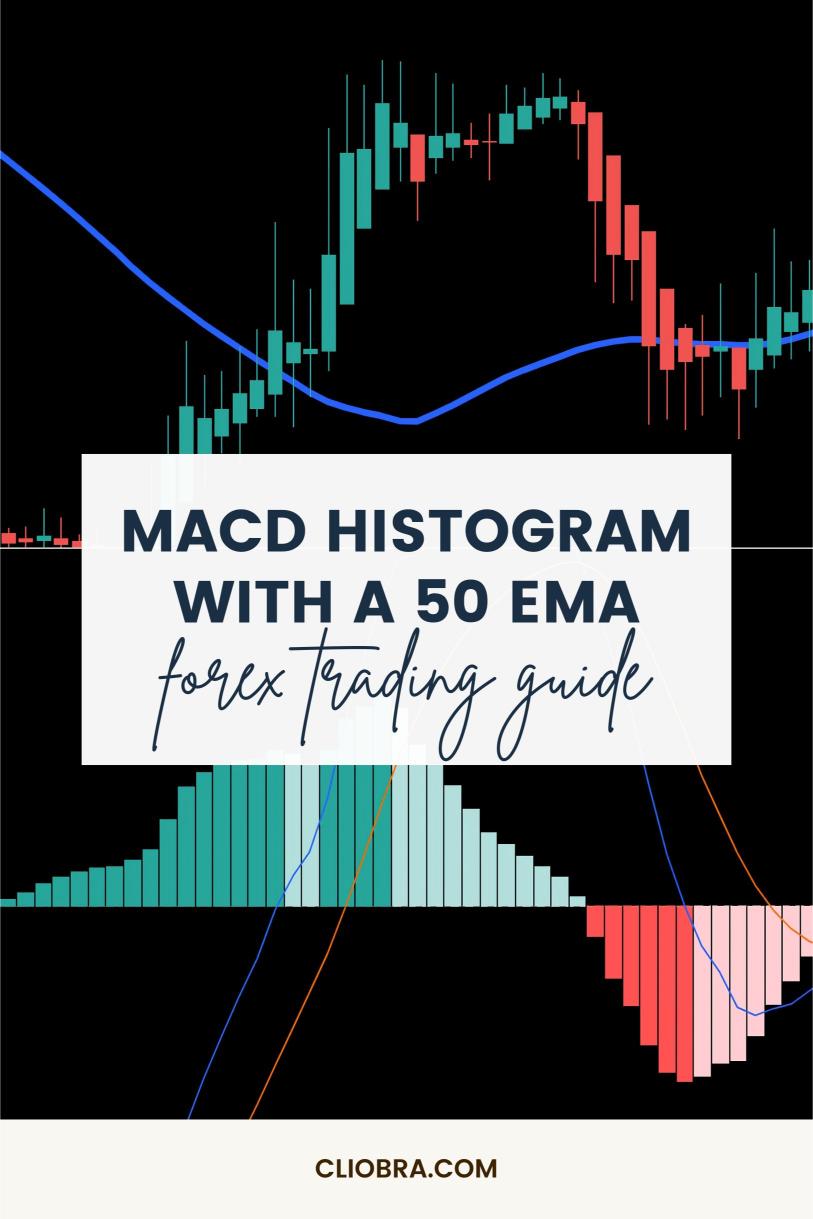
What’s the MACD Histogram?
The MACD (Moving Average Convergence Divergence) Histogram is a momentum indicator that shows the relationship between two moving averages.
It helps you identify potential buy and sell signals based on momentum shifts.
Key points:
- Direction: When the histogram is above zero, it indicates bullish momentum.
- Divergence: If prices are moving in one direction while the MACD is moving in another, that’s a signal to pay attention.
- Timing: The histogram often provides early signals compared to price action alone.
What’s the 50 EMA?
The 50 EMA (Exponential Moving Average) smooths out price data over a period of 50 periods.
It’s widely used to identify trends and potential support or resistance levels.
Why the 50 EMA?
- Trend Identification: If the price is above the 50 EMA, it’s generally considered an uptrend.
- Dynamic Support/Resistance: Price often reacts around the 50 EMA, making it an essential level to watch.
- Simplicity: It’s easy to understand and apply, making it a favorite among traders.
Why Combine Them?
Combining the MACD Histogram with the 50 EMA can create a robust entry strategy.
Here’s how to make the most of this combo.
Steps to Combine MACD and 50 EMA
- Identify the Trend:
- Check the position of the price relative to the 50 EMA.
- If the price is above the 50 EMA, look for buy signals.
- If it’s below, focus on sell signals.
- Look at the MACD Histogram:
- Wait for the histogram to cross above zero for a buy signal.
- For a sell signal, look for it to cross below zero.
- Confirm with Divergence:
- If the histogram is showing divergence with price, that’s a strong signal!
- For instance, if prices are making new highs but the MACD isn’t, it could indicate a reversal.
- Set Your Stop Loss:
- Place your stop loss just below the 50 EMA for buy entries or just above it for sell entries.
- This way, you’re keeping your risk in check.
- Take Profit Targets:
- Target a risk-reward ratio of at least 1:2.
- Use previous support and resistance levels for potential exit points.
The Power of Automation
Now, you might be thinking, “This sounds great, but how do I implement it consistently?”
That’s where my 16 trading bots come in.
These bots utilize the MACD Histogram with a 50 EMA strategy among others, ensuring that you’re not just relying on manual trading.
They’re designed to trade long-term, targeting 200-350 pips, and have been backtested over 20 years to perform well under various market conditions.
Quick Stats to Consider
- Studies show that traders using multiple indicators can improve their success rate by up to 30%.
- The average trader only uses 1-2 indicators, often missing out on opportunities.
Wrapping It Up
Combining the MACD Histogram with a 50 EMA is a straightforward yet effective strategy.
It’s all about timing and trend recognition.
While you’re mastering this combo, consider automating your trades with my trading bots for even better results.
And don’t forget, using a solid broker can make a world of difference.
Check out the best forex brokers I’ve tested for your trading journey.
By leveraging these strategies and tools, you’ll be on your way to more consistent and profitable trading.
So grab a coffee, set up your charts, and let’s get trading!