Last Updated on February 25, 2025 by Arif Chowdhury
Have you ever felt overwhelmed by the sheer amount of trading strategies out there?
Or maybe you’ve wondered how to effectively manage risk while maximizing profits?
I’ve been there too, and after years of navigating the Forex markets since 2015, I’ve developed a strategy that blends Bollinger Bands with Fibonacci Retracement.
This combo can enhance your risk management game and help you stay ahead of the curve.
Let’s dive into how you can use these tools effectively.
Understanding Bollinger Bands
First off, what are Bollinger Bands?
They consist of three lines:
- Middle Band: A simple moving average (SMA) that acts as a trend indicator.
- Upper Band: This is two standard deviations above the SMA.
- Lower Band: Two standard deviations below the SMA.
The beauty of Bollinger Bands is that they expand and contract based on market volatility.
Did you know?
Studies show that about 90% of price action occurs within the bands, making them a reliable tool for identifying potential reversal points.
What About Fibonacci Retracement?
Now, let’s talk about Fibonacci Retracement.
These levels are derived from the Fibonacci sequence and are used to identify potential support and resistance levels.
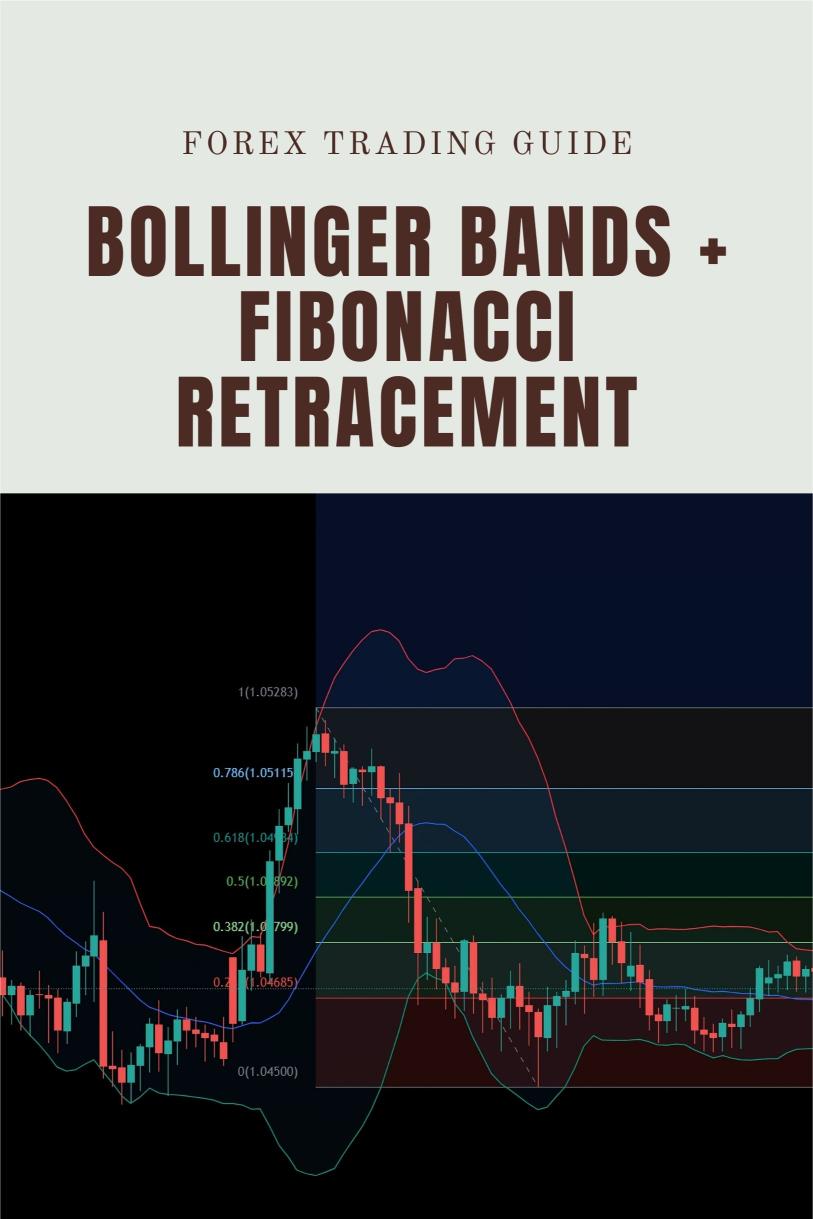
The key Fibonacci levels you should focus on are:
- 23.6%
- 38.2%
- 50%
- 61.8%
- 76.4%
These percentages help traders pinpoint where the price might bounce or reverse.
When combined with Bollinger Bands, you can identify not only where the price might head but also where it might face obstacles.
The Magic Happens When You Combine Them
Here’s how you can effectively combine Bollinger Bands and Fibonacci Retracement for better risk management:
- Identify the Trend: Use the middle Bollinger Band to confirm the trend direction. If the price is above the middle band, you’re likely in an uptrend. Below it? You’re in a downtrend.
- Set Fibonacci Levels: Draw Fibonacci retracement levels on your chart after identifying a recent swing high and swing low.
- Look for Confluence: Find areas where the Fibonacci levels overlap with the Bollinger Bands. For instance, if the price retraces to the 61.8% level and touches the lower Bollinger Band, it’s a strong signal to consider a buy.
- Manage Your Risk: Place stop-loss orders just outside the bands. This way, you’re protected if the market decides to move against you.
- Adjust Your Position Size: Depending on the strength of the signals, adjust your position size. If there’s strong confluence, consider increasing your trade size.
The Power of Diversification
As I mentioned earlier, I’ve developed a portfolio of 16 trading bots that utilize various strategies, including the Bollinger Bands and Fibonacci Retracement combo.
Each bot is designed to trade on major currency pairs like EUR/USD, GBP/USD, USD/CHF, and USD/JPY.
This multi-layered diversification ensures that you’re not putting all your eggs in one basket.
Why is this important?
Statistically, a diversified portfolio can reduce risk by up to 30%.
My bots are also tailored to minimize correlated losses, ensuring better performance over the long term.
You can check out my trading bot portfolio for FREE.
Keep Your Eye on the Best Brokers
As you implement these strategies, don’t forget the importance of choosing the right broker.
The best brokers offer:
- Tight spreads for better entry and exit points.
- Fast order execution to capitalize on market movements.
- Excellent customer support for when you need assistance.
I’ve personally tested various brokers and recommend checking out the best options.
Conclusion
Combining Bollinger Bands with Fibonacci Retracement can significantly improve your risk management strategies.
By understanding how to use these tools together, you can make more informed trading decisions and potentially enhance your profitability.
Don’t forget to explore my trading bot portfolio for a reliable, automated approach to trading.
Remember, the right tools and the right broker can make all the difference in your trading journey.