Last Updated on March 13, 2025 by Arif Chowdhury
Ever felt lost in the noise of the Forex market?
You’re not alone.
Many traders struggle with making sense of market movements.
How do you spot trends without getting whipsawed by false signals?
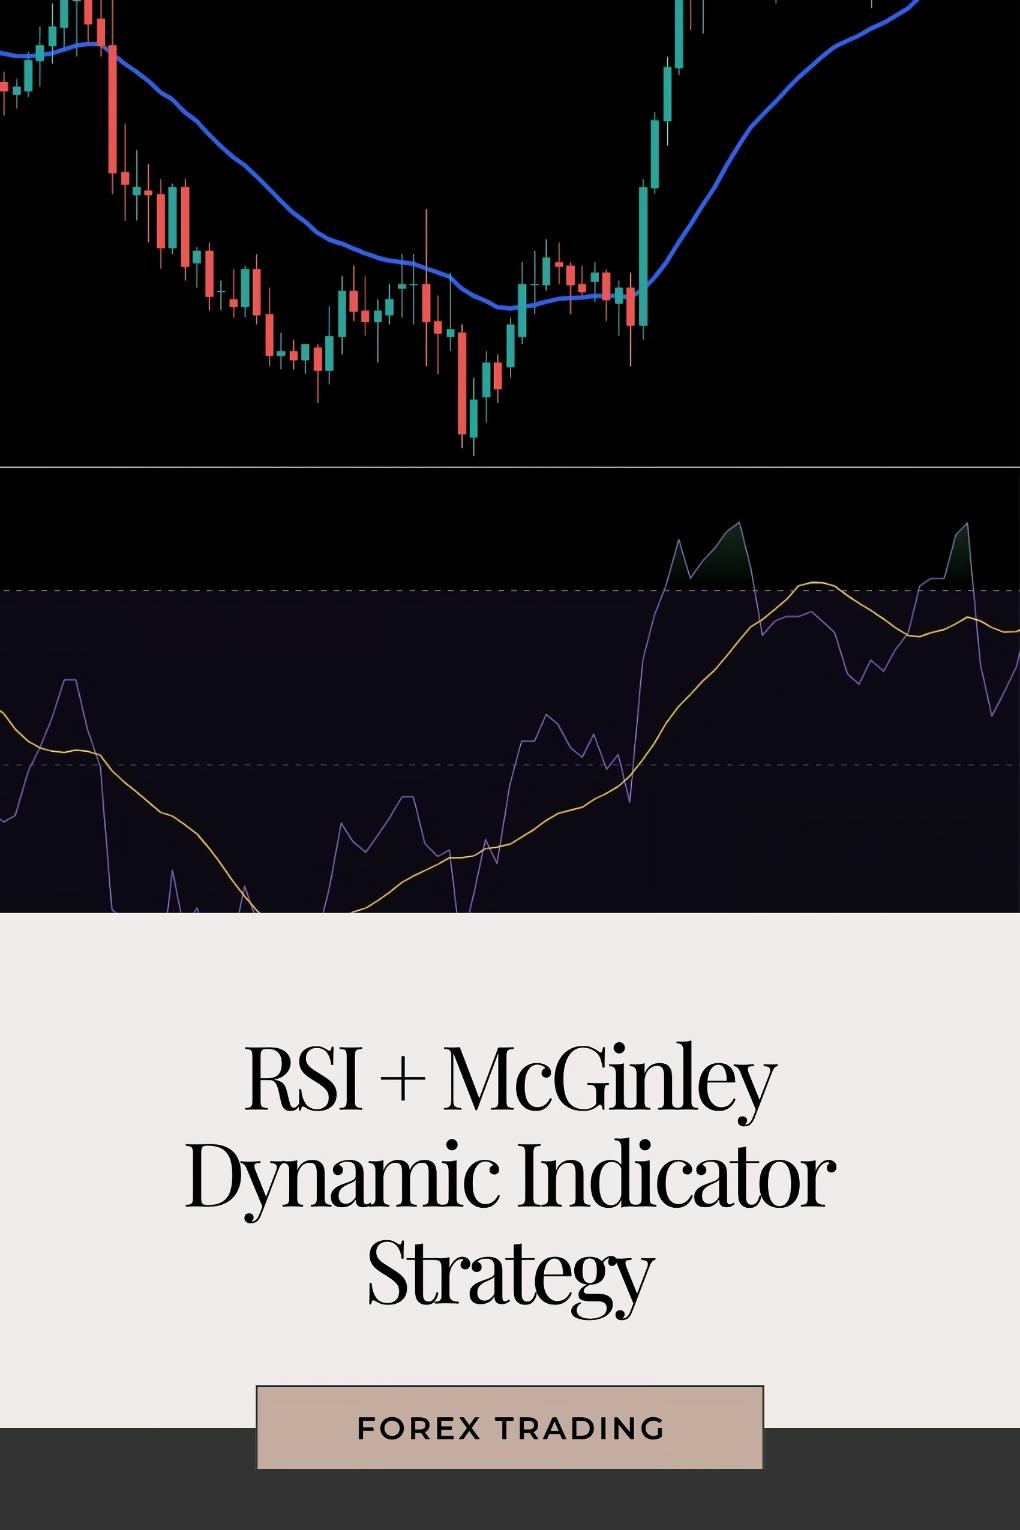
Let’s dive into a powerful combo: the RSI (Relative Strength Index) and the McGinley Dynamic Indicator.
These tools can help you trade trends more smoothly and confidently.
Why Use RSI?
The RSI is a momentum oscillator that measures the speed and change of price movements.
- Ranges from 0 to 100.
- Typically, an RSI above 70 indicates overbought conditions.
- An RSI below 30 suggests oversold conditions.
This gives you a quick view of market sentiment.
Statistically, about 70% of traders use some form of momentum indicator, and the RSI is one of the most popular choices.
Enter the McGinley Dynamic
Now, let’s bring in the McGinley Dynamic.
Developed by John McGinley, it’s a smoothed moving average that adjusts itself based on the speed of price movements.
Why is that important?
- It reacts faster to price changes than traditional moving averages.
- It helps filter out market noise, offering a clearer view of the trend.
What’s cool?
It’s not just about following the price. It’s about understanding how the price behaves.
Combining the Two
So, how do you combine these two indicators for a winning strategy?
- Set Up Your Chart:
- Add the RSI with a standard 14-period setting.
- Add the McGinley Dynamic with a default setting (often set to 14).
- Identify Trends:
- When the RSI crosses above 30, it signals potential upward momentum.
- When the price is above the McGinley Dynamic, it confirms a bullish trend.
- Entry Signals:
- Look for RSI to break above 50.
- If the price is above the McGinley Dynamic, consider entering a long position.
- Exit Signals:
- If the RSI approaches 70, it might be time to take profits.
- A close below the McGinley Dynamic could also signal an exit.
Why This Works
The combination of RSI and McGinley Dynamic helps you avoid false breakouts.
- The RSI gives you momentum.
- The McGinley Dynamic provides trend direction.
By using both, you can make more informed trading decisions.
My Trading Bots and This Strategy
Since 2015, I’ve been perfecting my trading strategies, including this RSI and McGinley Dynamic combo.
I’ve developed 16 sophisticated trading bots that utilize various strategies, including this one.
These bots trade on major pairs: EUR/USD, GBP/USD, USD/CHF, and USD/JPY.
They’re designed to minimize risk while maximizing returns, aiming for 200-350 pips over the long term.
What’s even better?
You can access this entire EA portfolio for FREE.
These bots are backtested over 20 years and perform excellently, even in tough market conditions.
Check them out here: Explore My Trading Bots.
Final Touches
Before you dive in, make sure you have a reliable broker.
Choosing the right broker can make a huge difference in your trading experience.
I’ve tested several and can confidently recommend some of the best Forex brokers.
They offer tight spreads, excellent customer support, and the tools you need to succeed.
Don’t just take my word for it—see for yourself: Top Forex Brokers.
Conclusion
Combining the RSI with the McGinley Dynamic Indicator is a game-changer.
It gives you the confidence to trade trends with less noise and more clarity.
And remember, with my FREE EA portfolio, you can leverage these strategies without the hassle.
Let’s make your trading journey smoother and more profitable!