Last Updated on March 16, 2025 by Arif Chowdhury
Are you tired of unpredictable market swings?
Wondering how to make sense of the chaos in Forex trading?
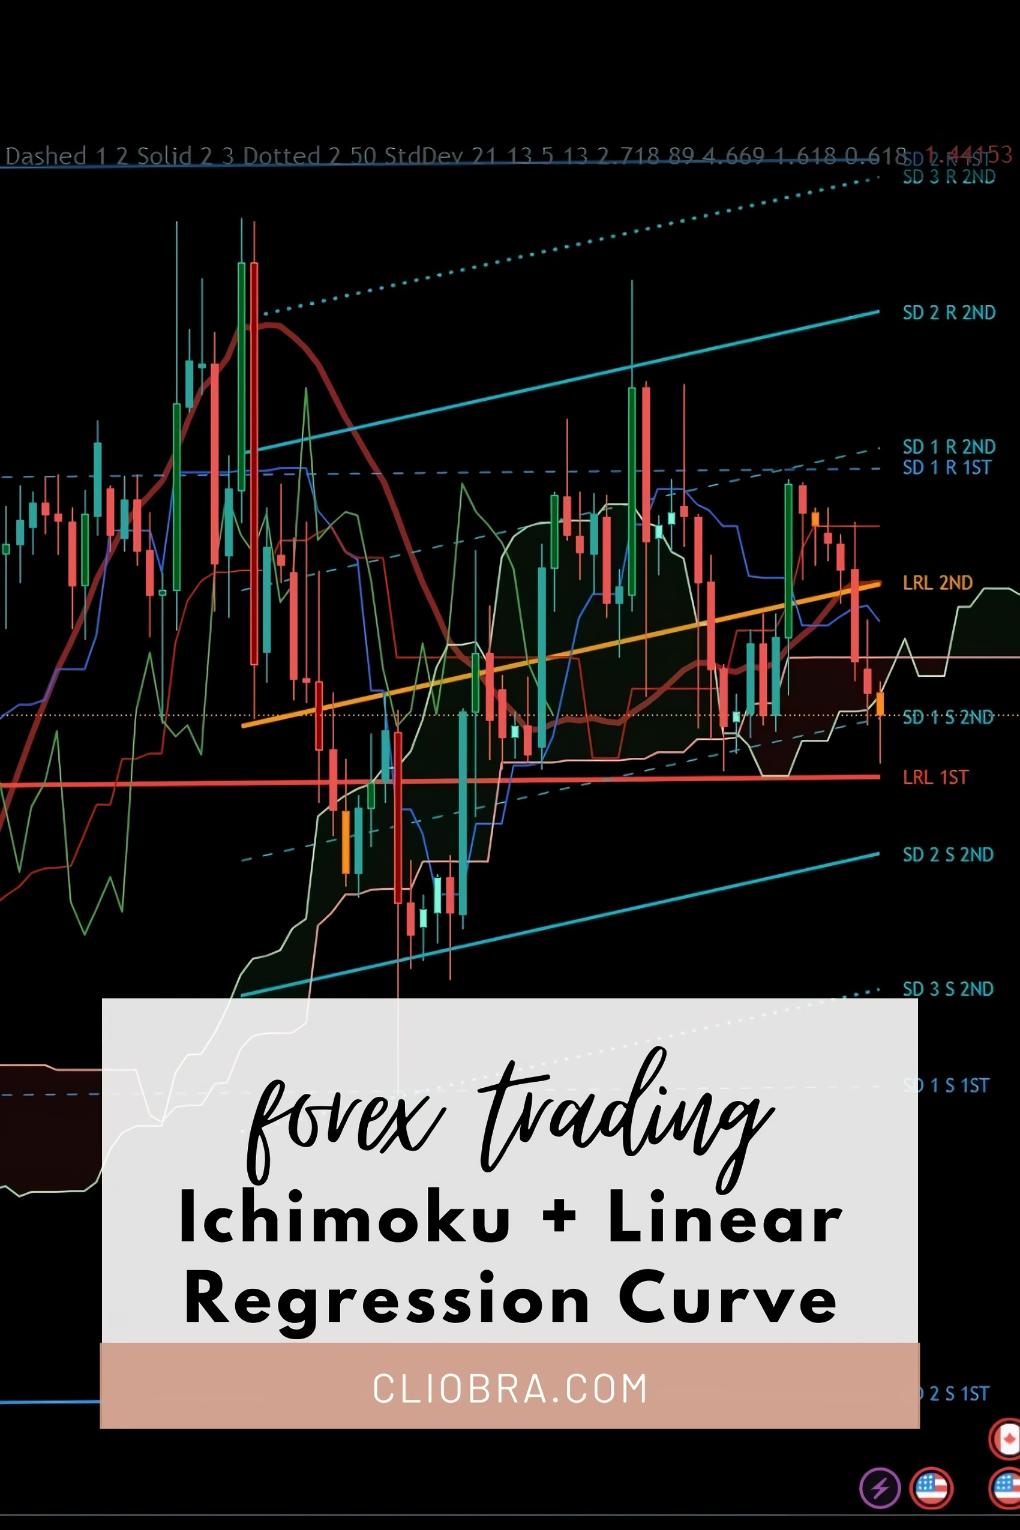
Let’s dive into a powerful combo that can enhance your trading game: the Ichimoku Cloud and Linear Regression Curve.
These tools can help you spot trends more effectively and make informed decisions.
As a seasoned Forex trader since 2015, I’ve explored countless strategies.
In my journey, I’ve found this combination to be a game-changer.
So, let’s break it down simply.
What is Ichimoku Cloud?
Ichimoku Cloud is more than just a fancy indicator.
It provides a comprehensive view of market trends, support, and resistance.
Here’s what you need to know:
- Five Key Components: It includes Tenkan-sen, Kijun-sen, Senkou Span A, Senkou Span B, and Chikou Span.
- Trend Identification: The cloud helps identify bullish or bearish trends at a glance.
- Support and Resistance: The edges of the cloud act as dynamic support and resistance levels.
What is Linear Regression Curve?
The Linear Regression Curve is a statistical tool that helps identify the overall direction of price movement.
Here’s why it’s crucial:
- Trend Lines: It calculates the best-fit line through historical price data.
- Predictable Trends: You can determine if prices are trending up, down, or sideways.
- Statistical Insight: According to studies, using regression analysis can improve forecasting accuracy by up to 30%.
Why Combine Them?
Combining Ichimoku with Linear Regression can amplify your trading strategy.
Here’s how:
- Trend Confirmation: Use Ichimoku to confirm the trend indicated by the Linear Regression Curve.
- Enhanced Signals: When both tools align, you get stronger buy/sell signals.
- Risk Management: Identify potential reversals or continuation patterns effectively.
How to Use Them Together
Let’s get practical.
Here’s a step-by-step guide:
- Set Up Your Charts:
- Add the Ichimoku Cloud to your chart.
- Overlay the Linear Regression Curve.
- Identify the Trend:
- Check the Ichimoku Cloud: Is the price above or below the cloud?
- Look at the Linear Regression Curve: Is it sloping upwards or downwards?
- Confirm with Signals:
- If both indicators agree (price above the cloud and an upward slope), it’s a strong buy signal.
- Conversely, if the price is below the cloud and the curve slopes downwards, it’s a sell signal.
- Monitor Support and Resistance:
- Use the cloud’s edges to set your stop-loss and take-profit levels.
- Stay Disciplined:
- Stick to your trading plan and avoid emotional decisions.
My Journey with Trading Bots
Now, let me share a little secret.
I’ve developed a portfolio of 16 sophisticated trading bots that utilize this Ichimoku + Linear Regression strategy among others.
These bots are designed to minimize risks while maximizing returns across major currency pairs like EUR/USD, GBP/USD, USD/CHF, and USD/JPY.
Their unique setup includes:
- Internal Diversification: Each pair has 3-4 bots, ensuring minimized correlated losses.
- Long-term Focus: They target 200-350 pips, performing better in the long run.
- Robust Performance: Backtested over 20 years, they thrive even in harsh market conditions.
Best of all? I’m offering this EA portfolio for FREE.
You can check it out here.
Best Practices for Success
To wrap things up, here are some key takeaways:
- Practice Makes Perfect: Spend time backtesting these strategies.
- Stay Informed: Follow Forex news and market trends.
- Choose the Right Broker: Your broker can impact your trading success. I recommend checking out some of the best Forex brokers I’ve tested here.
Final Thoughts
Combining the Ichimoku Cloud with the Linear Regression Curve can make your trading more predictable and less stressful.
Don’t hesitate to explore this strategy further.
And remember, my 16 trading bots are here to assist you in your trading journey—absolutely free.
Happy trading! 🚀