Last Updated on March 13, 2025 by Arif Chowdhury
Ever felt like the Forex market is a wild rollercoaster? 🎢
One moment it’s soaring, the next, it’s plummeting.
How do you catch the right wave without wiping out?
Let’s talk about a killer combo: Bollinger Bands and Parabolic SAR.
These tools can help you navigate choppy waters and make scalping in volatile markets a breeze.
Why Use Bollinger Bands and Parabolic SAR?
Both indicators provide unique insights into market behavior.
Bollinger Bands show you volatility and potential price levels.
Parabolic SAR gives you clear entry and exit signals.
When combined, they create a powerhouse strategy.
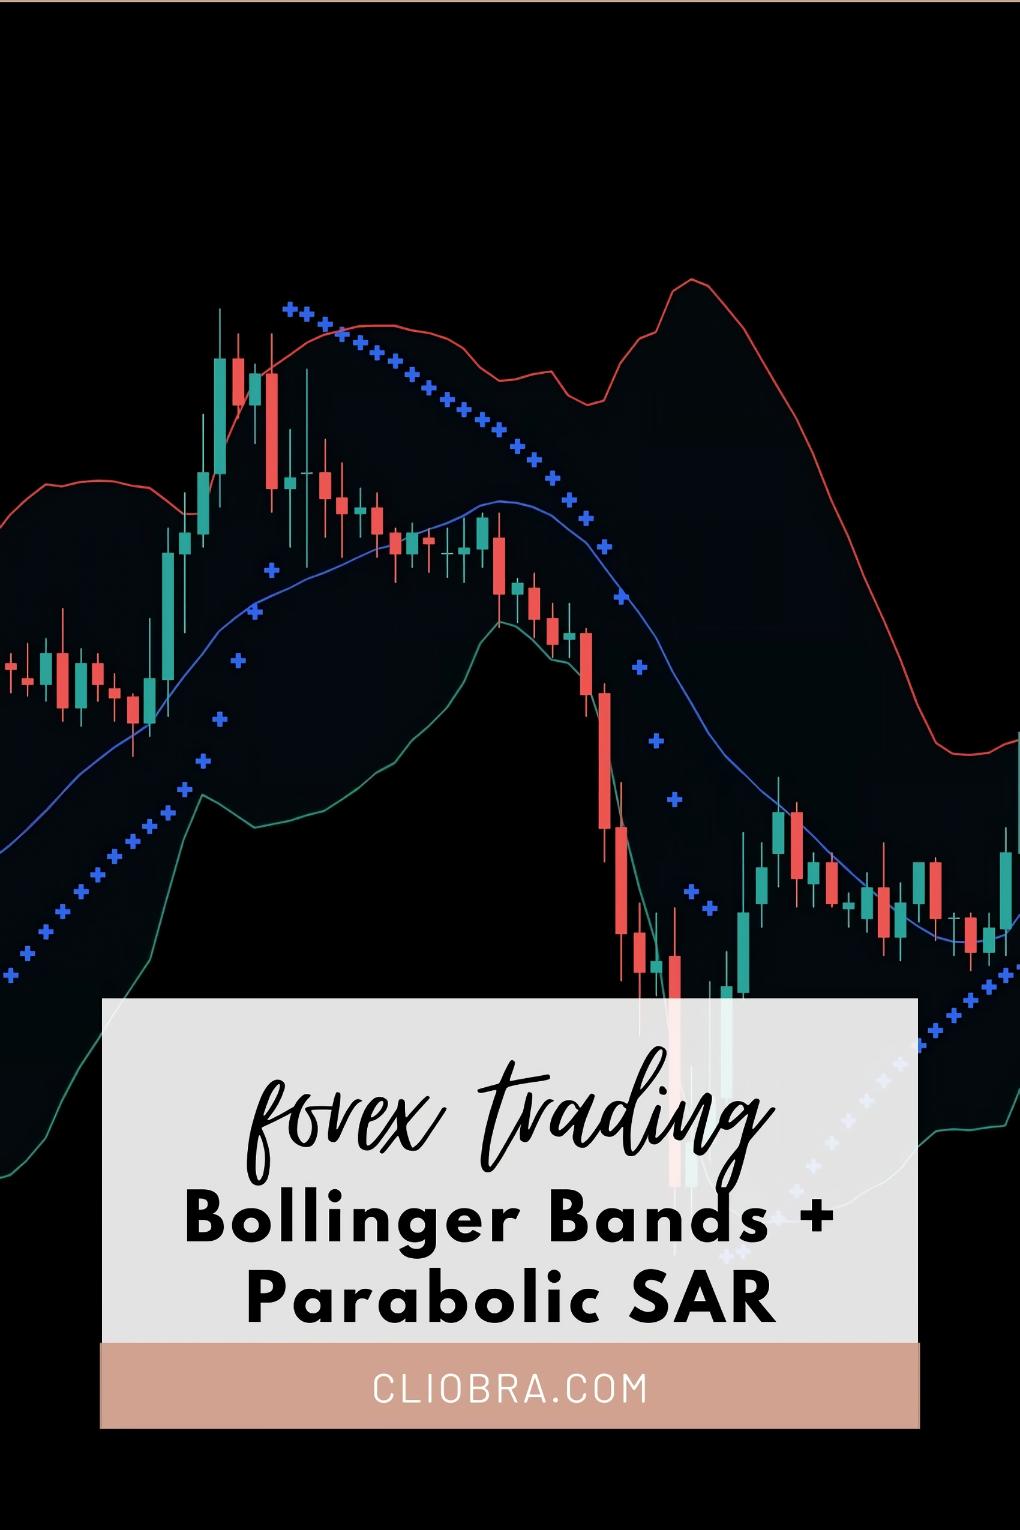
What Are Bollinger Bands? 📈
Bollinger Bands consist of three lines:
- Middle Band: The simple moving average (SMA) of the price.
- Upper Band: The SMA plus two standard deviations.
- Lower Band: The SMA minus two standard deviations.
Key Points:
- When the price hits the upper band, it may be overbought.
- When it touches the lower band, it may be oversold.
- The bands widen and contract, reflecting market volatility.
Statistically, markets tend to revert to the mean, making Bollinger Bands a handy tool for scalpers.
Understanding Parabolic SAR 📉
Parabolic SAR (Stop and Reverse) is a trend-following indicator, helping you identify potential reversals.
- Dots Above the Price: Indicates a downtrend.
- Dots Below the Price: Indicates an uptrend.
Key Points:
- It’s simple: when the dots switch sides, it’s time to reconsider your position.
- Use it to set stop-loss orders and trailing stops.
How to Combine Them for Scalping
Now, let’s put these two indicators together.
- Set Up Your Chart:
- Use a 5-minute or 15-minute timeframe for scalping.
- Add Bollinger Bands and Parabolic SAR to your chart.
- Look for Signals:
- Wait for price to touch the Bollinger Bands.
- Check the Parabolic SAR: Is it signaling a trend reversal?
- Entry Point:
- Buy when the price hits the lower Bollinger Band and the Parabolic SAR is below the price.
- Sell when the price hits the upper Bollinger Band and the Parabolic SAR is above the price.
- Manage Your Trades:
- Set a tight stop-loss just outside the bands.
- Consider taking profits when the price reaches the middle band.
Why This Strategy Works
In volatile markets, the combination of these indicators helps identify quick opportunities.
According to statistics, traders using Bollinger Bands in conjunction with other indicators see a 20% higher success rate in their trades.
My Proven Approach
As a seasoned Forex trader since 2015, I’ve crafted a unique trading strategy that consistently profits from market fluctuations.
I’ve implemented strategies like Bollinger Bands + Parabolic SAR in my 16 sophisticated trading bots.
These bots are diversified across major currency pairs: EUR/USD, GBP/USD, USD/CHF, and USD/JPY.
Each bot is built to minimize correlated losses, enhancing overall profitability while reducing risk.
And guess what? I’m offering this EA portfolio completely FREE!
You can check it out and see how it can amplify your trading game.
Choosing the Right Forex Brokers
To maximize your trading success, you need a reliable broker.
I’ve tested multiple brokers and recommend those with:
- Tight spreads
- Fast order execution
- Exceptional customer support
These factors can significantly impact your trading experience.
👉 Check Out the Best Forex Brokers
Final Thoughts
Combining Bollinger Bands and Parabolic SAR is a powerful strategy for scalping in volatile markets.
You can navigate the ups and downs like a pro.
Statistically, using these tools together can elevate your trading success.
Don’t forget to leverage my FREE EA portfolio and make sure you’re trading with the right broker.
Your trading journey starts now! 🚀