Last Updated on March 22, 2025 by Arif Chowdhury
🚀 Let’s cut straight to the chase.
As a seasoned Forex trader since 2015, I’ve witnessed countless strategies come and go.
But mean reversion? That’s stood the test of time.
What Makes Mean Reversion So Powerful? 💪
Mean reversion is based on a simple statistical truth: prices eventually return to their average.
Did you know that approximately 80% of forex market movements are mean-reverting rather than trending? That’s a massive edge if you know how to capture it.
The beauty lies in its simplicity and statistical backing.
When a currency pair deviates too far from its average, it creates a high-probability setup.
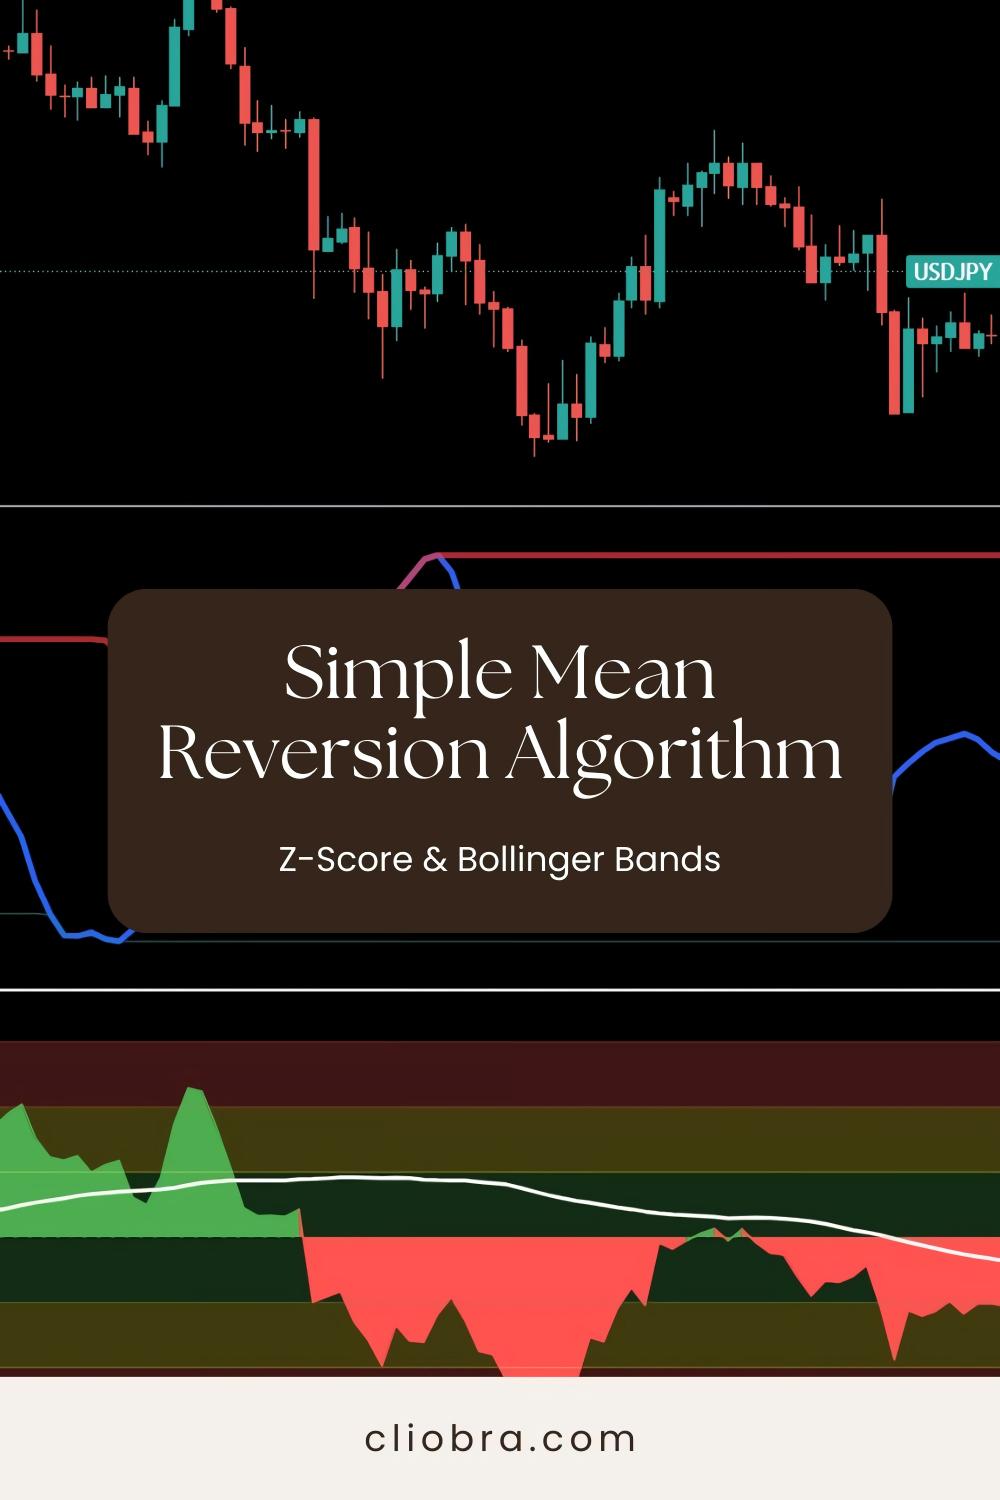
The Z-Score: Your Statistical Edge 📊
Z-Score measures how many standard deviations a data point sits from the mean.
Think of it as your market GPS – it tells you exactly how “extreme” current prices are.
The formula is straightforward: Z = (Current Price – Moving Average) / Standard Deviation
Z-Score above +2: Potentially overbought Z-Score below -2: Potentially oversold
These extremes represent opportunities where the rubber band has stretched too far.
Bollinger Bands: Your Visual Confirmation 📈
Bollinger Bands add a powerful visual element to mean reversion.
They consist of:
- Middle band (typically 20-period moving average)
- Upper band (MA + 2 standard deviations)
- Lower band (MA – 2 standard deviations)
When price touches or exceeds the bands, it signals potential reversal points.
A fascinating stat: Prices stay within the Bollinger Bands approximately 95% of the time, making band touches statistically significant events.
Building Your Mean Reversion Algorithm 🔧
Here’s how to construct a simple yet effective mean reversion system:
- Calculate your Z-Score
- Choose your lookback period (20-50 periods works well)
- Compute the moving average
- Calculate the standard deviation
- Apply the Z-Score formula
- Set Up Your Bollinger Bands
- Apply standard 20-period Bollinger Bands
- Use 2 standard deviations for band width
- Define Entry Conditions
- Enter when Z-Score exceeds +/-2
- Confirm with price touching/exceeding Bollinger Bands
- Look for candlestick reversal patterns at band extremes
- Set Profit Targets and Stop Loss
- Target: Return to the moving average (middle band)
- Stop Loss: 1.5x the recent average true range
My Secret Weapon: Multi-Strategy Diversification 🛡️
While building a basic mean reversion algorithm is powerful, my trading journey led me to create a portfolio of 16 diverse trading bots that leverage multiple strategies, including advanced Z-Score and Bollinger Band implementations.
These bots trade across EUR/USD, GBP/USD, USD/CHF, and USD/JPY on H4 timeframes, targeting 200-350 pip moves for substantial profits.
The advanced algos have been backtested across 20 years of data and perform exceptionally even in harsh market conditions.
Want to check them out? My complete EA portfolio is available for FREE at Trading Bot Portfolio.
Common Pitfalls to Avoid ⚠️
- Ignoring market context
- Mean reversion works best in ranging markets
- Be cautious during major news events
- Overtrading
- Not every band touch is a valid signal
- Wait for confirmation patterns
- Poor position sizing
- Risk no more than 1-2% per trade
- Scale position size with signal strength
Fine-Tuning Your Algorithm 🔬
For best results, test these variations:
- Experiment with different lookback periods
- Try Z-Score thresholds between 1.5-3
- Combine with volume indicators
- Add RSI divergence confirmation
The Broker Factor 🏦
Even the best algorithm needs the right execution environment.
After years of testing dozens of brokers, I’ve compiled a list of the most reliable ones with tight spreads and fast execution.
Check out my thoroughly vetted broker recommendations at Top Forex Brokers.
Ready to Implement? 🚀
Building a mean reversion strategy using Z-Score and Bollinger Bands gives you a statistical edge in the markets.
Start small, backtest thoroughly, and consider implementing my diversified approach across multiple currency pairs.
Remember: consistency beats complexity every time.
The most successful traders aren’t the ones with the most complicated strategies.
They’re the ones who understand market statistics and leverage them consistently.
Ready to take your trading to the next level? The tools are in your hands.