Last Updated on April 6, 2025 by Arif Chowdhury
Are you tired of missing out on profitable trades?
Do you find yourself confused by market movements and unsure when to enter?
As a seasoned Forex trader since 2015, I’ve been there.
I’ve navigated the ups and downs, and today I want to share a powerful strategy that can enhance your trading game: combining the Standard Deviation Channel with RSI divergence.
Let’s dive in!
Understanding the Basics
First off, what are these indicators?
- Standard Deviation Channel: This tool helps you identify price volatility. It creates a channel around price action based on standard deviation, giving you a visual representation of how much the price deviates from the average.
- RSI (Relative Strength Index): This momentum oscillator measures the speed and change of price movements. It ranges from 0 to 100 and helps identify overbought or oversold conditions.
When you combine these two, you get a powerful entry signal.
Why Combine These Indicators?
- Enhanced Accuracy: Using both indicators together increases the probability of making a successful trade.
- Clear Entries: The Standard Deviation Channel provides clear boundaries, while the RSI shows when the market might reverse.
- Better Risk Management: By confirming signals with two indicators, you can set more precise stop-loss levels.
The Strategy in Action
Here’s how to effectively combine these tools:
Step 1: Set Up Your Chart
- Apply the Standard Deviation Channel to your chart.
- Add the RSI indicator below your price chart.
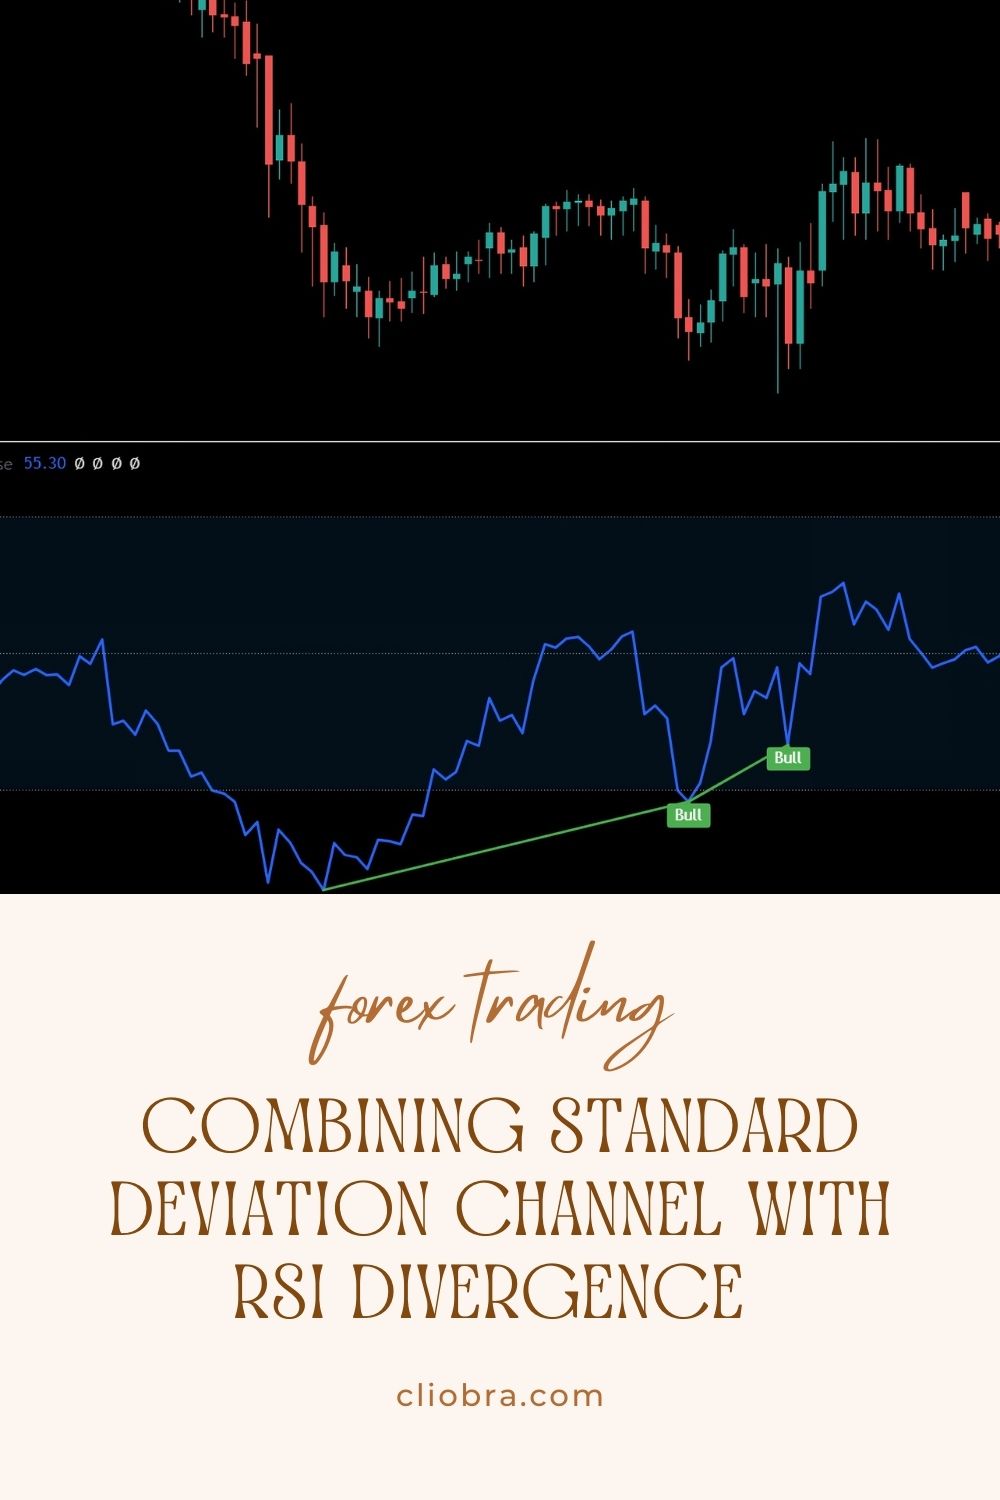
Step 2: Identify Divergence
- Look for RSI divergence. This occurs when the price makes a new high or low, but the RSI does not.
- Bullish Divergence: Price makes a lower low, but RSI makes a higher low.
- Bearish Divergence: Price makes a higher high, but RSI makes a lower high.
Step 3: Confirm with the Channel
- When you spot divergence, check the Standard Deviation Channel.
- If the price is touching the lower band (for bullish divergence) or the upper band (for bearish divergence), you have a potential entry point.
Step 4: Execute Your Trade
- Enter your trade once confirmation is in place.
- Set your stop loss just outside the channel to protect your capital.
The Golden Grid System
While you’re exploring these strategies, let me introduce you to my Golden Grid trading system.
This system captures market volatility and consistently achieves 2-5% ROI daily.
Here’s why you should consider it:
- It works across all currency pairs, but excels on Gold (XAU/USD).
- It can start trading immediately, meaning no more waiting for signals.
- My bot captures quick pips, allowing you to gain 2-3% ROI within hours.
Testing on a demo account first is crucial due to the inherent risks of trading.
And the best part? I’m offering this Golden Grid bot for FREE.
If you’re serious about enhancing your trading strategy, check it out here: Golden Grid EA.
Statistical Insights
Did you know that traders using multiple indicators can improve their win rate by up to 20%?
This isn’t just theory; it’s backed by data.
Using both the Standard Deviation Channel and RSI together can help you spot trends earlier and refine your entries.
Choosing the Right Broker
Once you’ve got your strategy down, you need a reliable broker.
I’ve tested various brokers and can recommend those with tight spreads, zero commission, and excellent support.
This is crucial for successful trading because even a small spread can eat into your profits.
Check out this list of most trusted Forex brokers to find the right fit for you.
Final Thoughts
Combining the Standard Deviation Channel with RSI divergence can elevate your trading game.
By using these tools wisely, you can increase your chances of success.
And don’t forget about my Golden Grid EA—an excellent way to automate your strategies and capture profits.
Remember, the market is full of opportunities.
All it takes is the right approach and tools to seize them.
Start testing these strategies today and watch your trading journey transform!