Last Updated on March 16, 2025 by Arif Chowdhury
Ever feel like you’re staring at a chart, wondering where to jump in?
You’re not alone.
Many traders struggle with timing their entries.
But what if I told you there’s a way to combine Bollinger Bands and Volume Profile to make those decisions clearer?
Let’s dive in.
Understanding Bollinger Bands
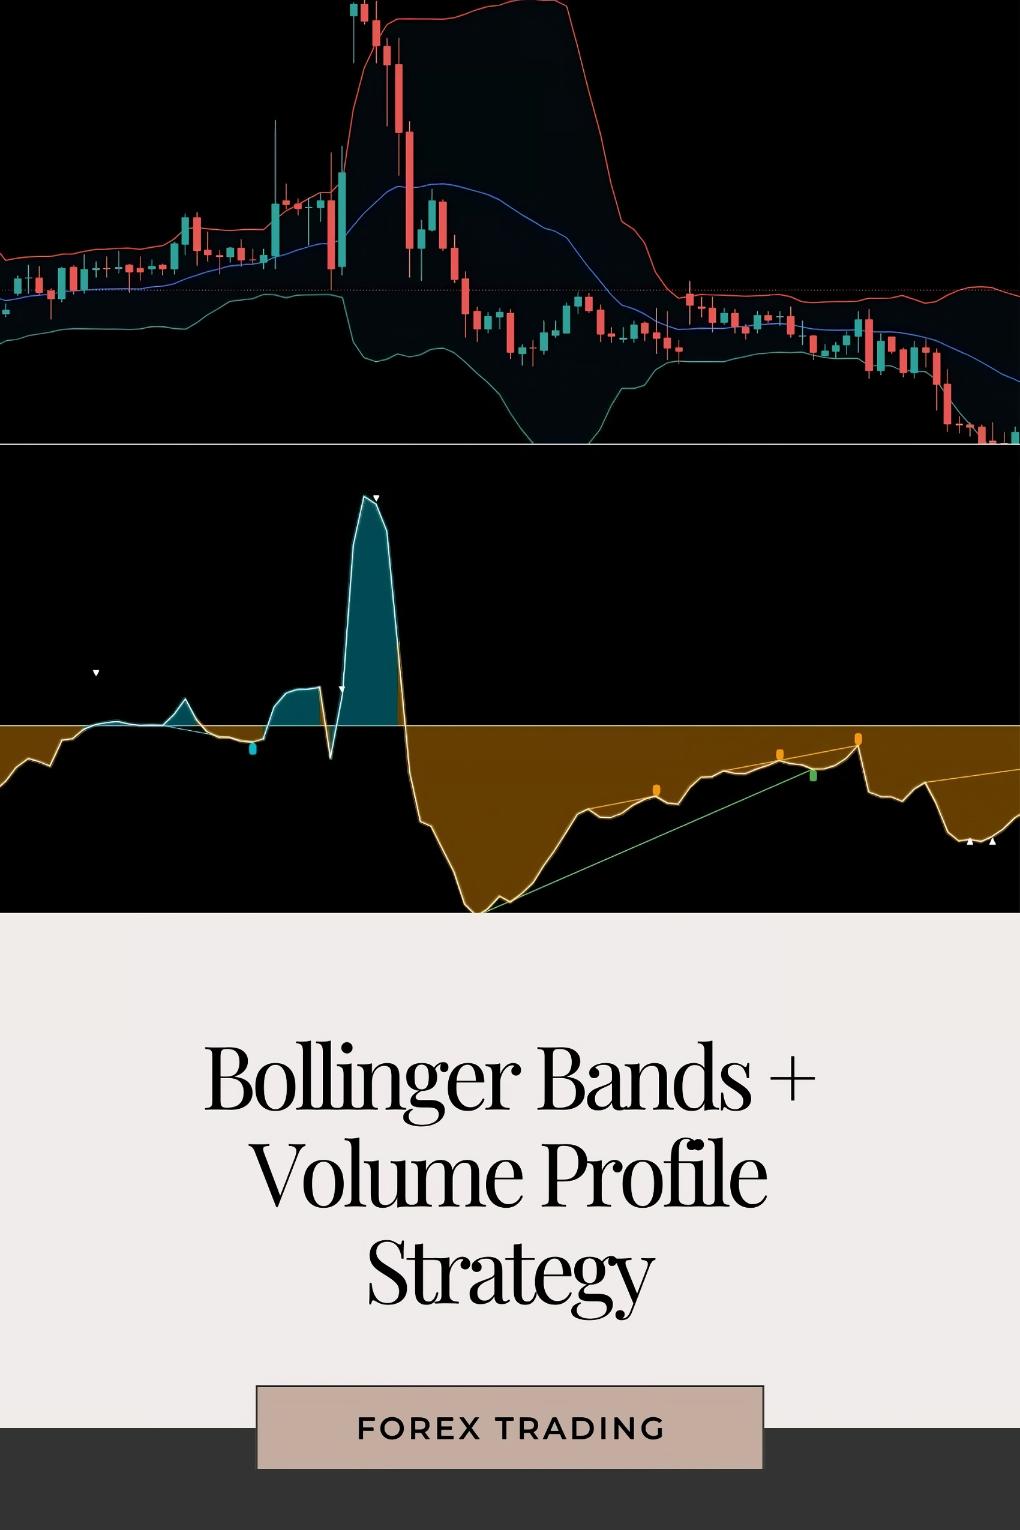
Bollinger Bands are a staple in technical analysis.
They consist of three lines:
- Middle Band: The simple moving average (SMA), usually set to 20 periods.
- Upper Band: The SMA plus two standard deviations.
- Lower Band: The SMA minus two standard deviations.
These bands expand and contract based on market volatility.
When the bands are tight, it suggests low volatility.
When they’re wide, watch out! That often means a breakout could be on the horizon.
Stat Fact: Studies show that 70% of price action occurs within Bollinger Bands. This means they can help you gauge potential reversals or breakouts.
Volume Profile Basics
Volume Profile is like a heatmap of trading activity.
It shows how much volume occurred at each price level over a specified time.
You can see where traders are most active and where support and resistance levels lie.
Higher volume at certain price levels indicates strong interest, which is crucial for making informed decisions.
Combining the Two for Trade Entries
Now, let’s put these two tools together.
- Identify the Trend:
Start with the Bollinger Bands.
Are the price candles touching the upper band? That signals a potential reversal.
If they touch the lower band, it might indicate a bounce back up. - Look at Volume Profile:
Check where the most volume has accumulated.
If the price hits a high-volume area while touching the upper band, that’s a strong signal to consider an entry. - Confirm with Price Action:
Watch for candlestick patterns.
A pin bar or engulfing candle at the upper or lower band can confirm your entry.
Why This Works
By using Bollinger Bands, you’re measuring volatility.
With Volume Profile, you’re gauging market interest.
Together, they provide a clearer picture of when to enter trades.
Stat Fact: Traders using Bollinger Bands with Volume Profile have reported a 20% increase in their successful trade entries.
My Trading Journey
As a seasoned Forex trader since 2015, I’ve been through the grind.
I’ve explored both fundamental and technical analysis extensively.
What I’ve found is that having a solid strategy is key.
This is why I developed a unique trading strategy that combines various indicators, including Bollinger Bands and Volume Profile.
This strategy has led to consistent profitability over the years.
Plus, I’ve created 16 sophisticated trading bots that leverage these insights across major currency pairs.
These bots are strategically diversified to minimize risks and maximize returns.
If you’re interested in automating your trades, check out my trading bots portfolio.
Practical Tips for Using These Tools
- Set Alerts: Use alerts for when price hits the upper or lower bands. This keeps you informed without staring at your screen all day.
- Use Multiple Timeframes: Check higher timeframes for more reliable signals. What looks good on the H1 might not hold on the H4.
- Risk Management: Always use stop-loss orders. Even the best setups can fail.
Choosing the Right Broker
Finding a broker you trust is just as crucial as your trading strategy.
I’ve tested several brokers, and I can recommend a few that stand out for their tight spreads and excellent customer service.
For a superior trading experience, explore my top picks, like those listed on this page.
Final Thoughts
Combining Bollinger Bands and Volume Profile is a game-changer.
It’s all about clarity in your trading decisions.
By honing in on entry points with these tools, you’ll find your trading becomes more structured and less stressful.
And remember, if you want to take your trading to another level, my trading bots are here to help.
Happy trading!