Last Updated on March 13, 2025 by Arif Chowdhury
Are you tired of missing out on profitable trades?
Do you feel overwhelmed by market noise and unsure when to pull the trigger?
Let’s simplify things.
Today, we’re diving into how to use Bollinger Bands and the Trend Intensity Index (TII) to confirm breakouts.
These tools can help you make informed decisions and boost your trading success.
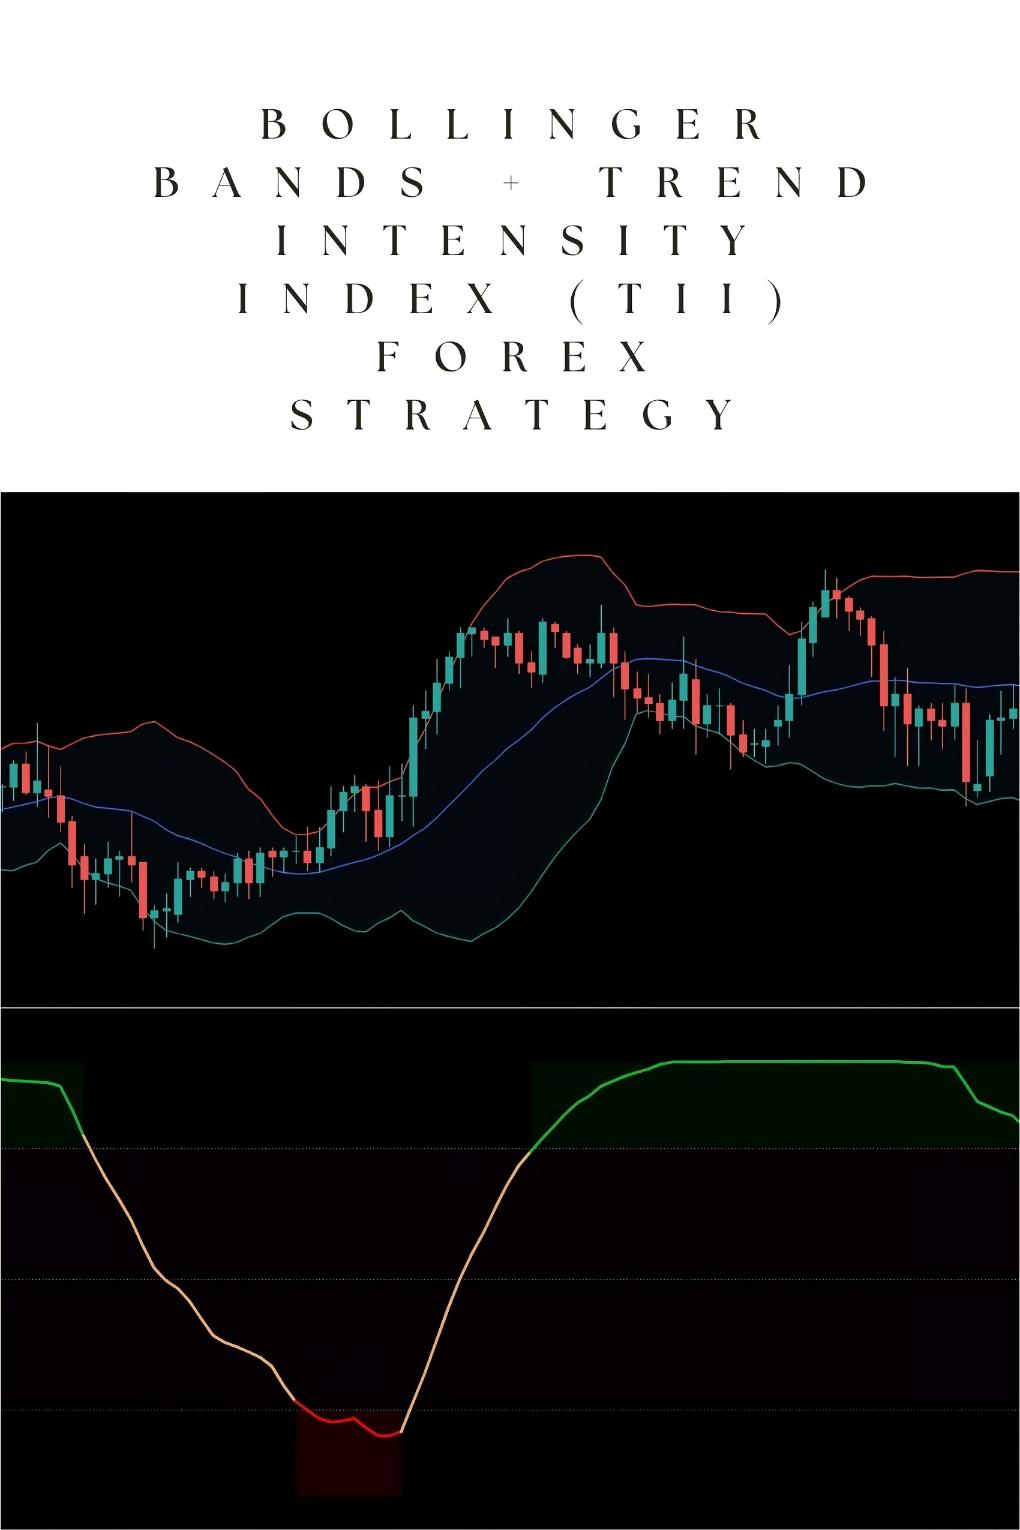
Understanding Bollinger Bands
Bollinger Bands are like your market compass.
They consist of three lines:
- The middle band is the simple moving average (SMA).
- The upper band is the SMA plus two standard deviations.
- The lower band is the SMA minus two standard deviations.
When the price touches the upper band, it might be overbought; when it touches the lower band, it might be oversold.
Key Facts
Did you know that about 70% of price action typically occurs between the Bollinger Bands?
This means that when prices break these bands, it often indicates a strong move.
Introducing the Trend Intensity Index (TII)
Now, let’s talk about the Trend Intensity Index.
TII measures the strength of a trend.
It’s a momentum oscillator that helps identify whether a trend is strengthening or weakening.
- A TII above 50 indicates a strong uptrend.
- A TII below 50 signals a downtrend.
Using TII alongside Bollinger Bands adds a layer of confirmation to your trades.
Combining Bollinger Bands and TII for Breakouts
Here’s how to use these two powerful tools together:
- Identify the Breakout:
- Look for the price to break above the upper Bollinger Band or below the lower band.
- This signals a potential breakout.
- Check the TII:
- Confirm the breakout by checking the TII.
- If the TII is above 50 during an upward breakout, it’s a strong signal to enter.
- If it’s below 50 during a downward breakout, it’s a clear indication to take action.
- Set Your Stop Loss:
- Always protect your capital.
- Place your stop loss just outside the opposite Bollinger Band.
- Take Profit Strategy:
- Aim for a risk-reward ratio of at least 1:2.
- This means for every dollar risked, aim to make two dollars.
My Trading Bots and Their Strategy
As a seasoned Forex trader since 2015, I’ve developed a unique trading strategy incorporating both Bollinger Bands and the TII, among other techniques.
I’ve created 16 sophisticated trading bots that utilize this strategy across major currency pairs—EUR/USD, GBP/USD, USD/CHF, and USD/JPY.
Each bot is designed to trade using H4 charts, focusing on long-term gains of 200-350 pips.
This multi-layered approach not only enhances profitability but also reduces the risk of correlated losses.
And the best part? I’m offering this EA portfolio for completely FREE!
If you’re serious about elevating your trading game, check out my trading bots portfolio.
Final Thoughts
Using Bollinger Bands and the Trend Intensity Index together can significantly improve your trading accuracy.
Start by integrating these tools into your analysis.
And remember, choosing the right broker is crucial.
I’ve tested and compiled a list of the best Forex brokers that provide tight spreads and great support.
Explore these options and see for yourself: Best Forex Brokers.
Trade smart, stay informed, and watch your profits grow!