Last Updated on March 5, 2025 by Arif Chowdhury
Are you tired of going in circles with your trading strategy?
Wondering how to spot trend reversals without getting lost in the noise?
You’re not alone. Many traders struggle with identifying when to jump in or out.
Let’s break it down.
I’ve been in the Forex game since 2015, and I’ve learned a thing or two about using indicators effectively.
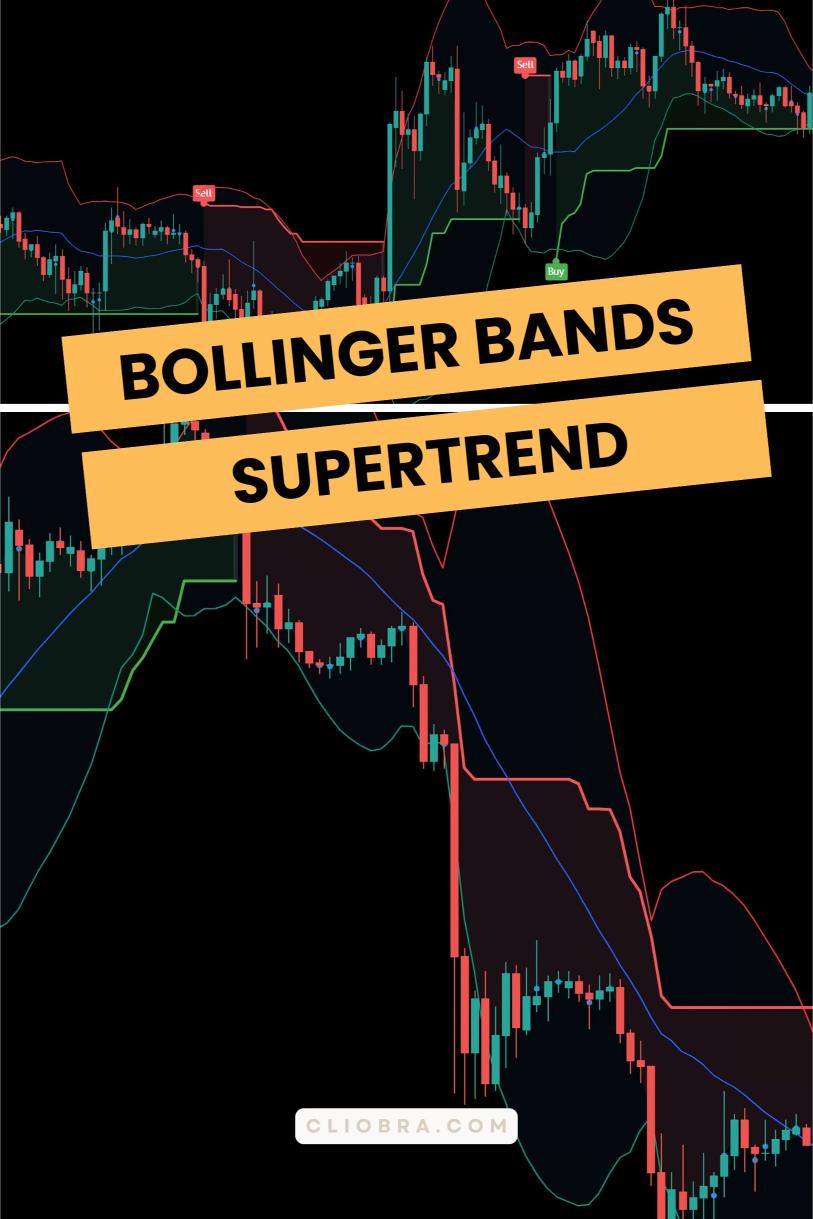
Today, I’ll show you how to use Bollinger Bands and the Supertrend Indicator to spot trend reversals.
Understanding Bollinger Bands
Bollinger Bands are like your trading best friend.
They help you see potential price action and volatility at a glance.
Here’s how they work:
- Middle Band: This is the simple moving average (SMA), usually set to 20 periods.
- Upper Band: This is +2 standard deviations from the SMA.
- Lower Band: This is -2 standard deviations from the SMA.
When price approaches the upper band, it’s considered overbought.
When it hits the lower band, it’s viewed as oversold.
Stat Fact: Studies show that approximately 90% of price action occurs between the upper and lower bands.
So, if you’re trading outside those bands, you might want to rethink your strategy.
Enter the Supertrend Indicator
Now, let’s throw the Supertrend Indicator into the mix.
This indicator helps you identify the current trend and potential reversals.
Here’s the scoop:
- It’s based on the Average True Range (ATR).
- When the price is above the Supertrend line, it indicates an uptrend.
- When it’s below, it signals a downtrend.
The beauty of combining these two indicators is you get a clearer picture of market conditions.
How to Use Them Together
- Identify the Trend:
- Use the Supertrend to determine if the market is in an uptrend or downtrend.
- Watch the Bands:
- Check where the price is in relation to the Bollinger Bands.
- If the price touches the lower band and the Supertrend is bullish, it might be a signal to buy.
- If the price hits the upper band and the Supertrend is bearish, consider selling.
- Look for Confirmation:
- Always look for confirmation signals.
- This could be additional indicators, candlestick patterns, or even news events.
- Set Your Stop Loss and Take Profit:
- Use the bands to help set these levels.
- For example, place your stop loss just outside the opposite band.
Why This Strategy Works
This strategy works because it combines trend-following and volatility.
By leveraging both indicators, you can better filter out false signals and focus on potential reversals.
Stat Fact: Traders who incorporate multiple indicators generally see a 20-30% increase in accuracy.
That’s a game-changer when you’re looking to maximize profits.
My Trading Bots and This Strategy
I didn’t just stop at manual trading.
I’ve developed 16 sophisticated trading bots that utilize the Bollinger Bands + Supertrend Indicator strategy, among others.
These bots are designed to trade across major pairs like EUR/USD and GBP/USD, focusing on long-term gains of 200-350 pips.
Each bot is crafted to minimize risk and maximize returns.
The multi-layered diversification ensures that even if one bot faces challenges, others can compensate.
You can check out my trading bot portfolio, and guess what?
I’m offering it for FREE!
Finding the Best Brokers
While you’re at it, make sure you’re trading with a trustworthy broker.
I’ve tested numerous brokers, and I recommend you check out the best forex brokers to ensure you’re getting tight spreads and excellent support.
Final Thoughts
Using Bollinger Bands and the Supertrend Indicator can dramatically improve your trading strategy.
By combining these tools, you’ll have a clearer view of trend reversals, helping you make more informed decisions.
Don’t forget to explore my trading bots for a hands-off approach that still utilizes these powerful strategies.
And always trade responsibly with a reliable broker.