Last Updated on February 28, 2025 by Arif Chowdhury
Ever feel like you’re staring at the charts, wondering what the big players are doing? 🤔
You’re not alone.
Many traders struggle to identify institutional activity in the Forex market.
But here’s the good news: combining Bollinger Bands with the Klinger Oscillator can give you a solid edge.
Let’s break this down.
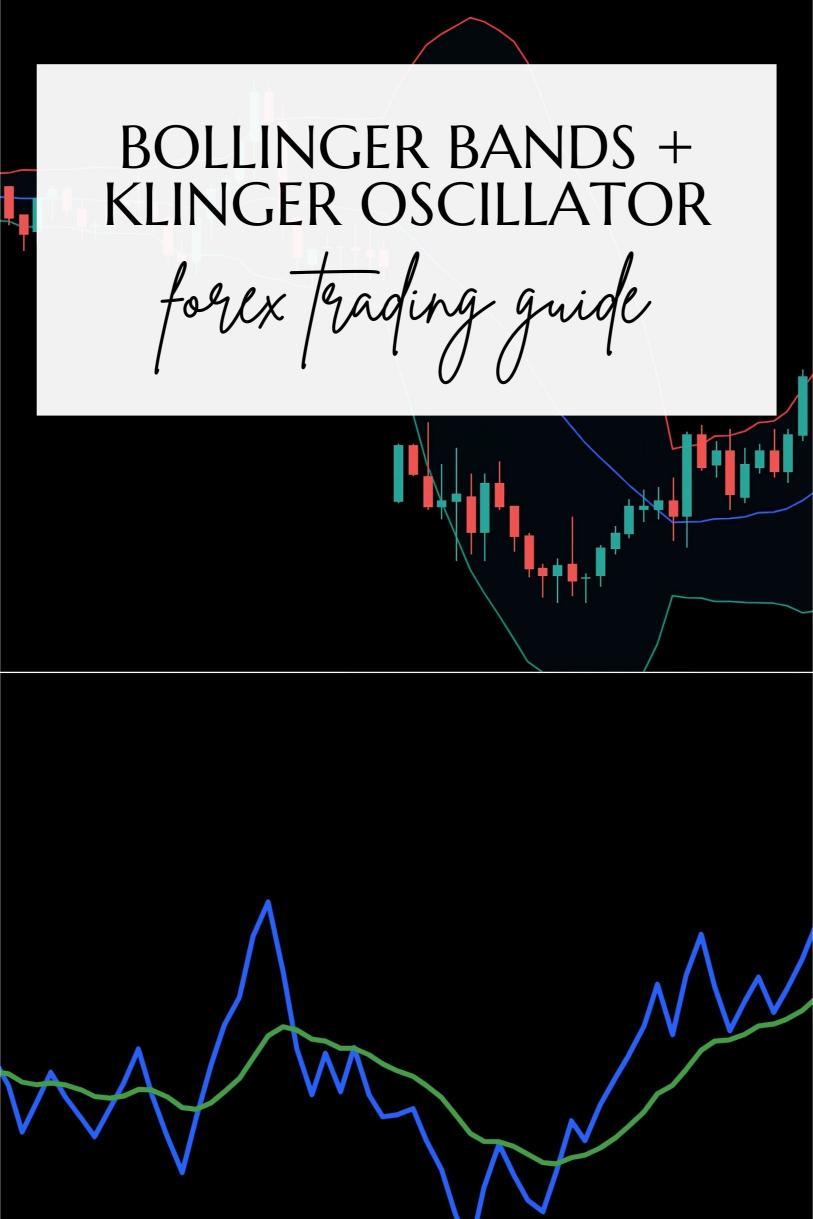
Understanding Bollinger Bands
Bollinger Bands are like the market’s mood ring.
They tell you if the market is calm or volatile.
Here’s how they work:
- Middle Band: This is a simple moving average (SMA). It shows the average price over a specific period.
- Upper Band: This band is the SMA plus two standard deviations. It indicates potential resistance.
- Lower Band: This band is the SMA minus two standard deviations. It indicates potential support.
When the price hits the upper band, it might be overbought.
When it touches the lower band, it could be oversold.
The Klinger Oscillator Explained
Now let’s talk about the Klinger Oscillator.
This tool helps you spot money flow, which is crucial for identifying institutional activity.
It does this by comparing the volume of price movements.
Key points to remember:
- Positive Klinger: Indicates bullish momentum.
- Negative Klinger: Indicates bearish momentum.
- Divergence: If the price moves up while the Klinger moves down, watch out. This could signal a reversal.
Why Combine Them?
Both tools provide unique insights.
Bollinger Bands help you gauge price extremes, while the Klinger Oscillator helps you understand the underlying volume trends.
When you combine them, you get a clearer picture of market conditions.
This combo is particularly useful for spotting institutional activity.
Steps to Use the Combo
- Set Up Your Chart: Use H4 charts for a longer-term view.
- Add Bollinger Bands: Set the period to 20 for the SMA, with a deviation of 2.
- Add Klinger Oscillator: Use the default settings for clarity.
- Look for Signals:
- Price Touches Upper Band: Check Klinger for a negative trend.
- Price Touches Lower Band: Check Klinger for a positive trend.
- Confirm with Volume: Look for spikes in volume to validate your signals.
Statistical Insights
Did you know that over 70% of traders fail because they don’t have a solid strategy?
By using Bollinger Bands and the Klinger Oscillator, you’re already ahead of the curve.
Also, studies show that incorporating volume into your analysis can increase your win rate by 20%.
Why My Trading Bots Use This Strategy
As a seasoned Forex trader since 2015, I’ve developed a robust trading strategy that leverages both Bollinger Bands and the Klinger Oscillator.
My exceptional trading bot portfolio comprises 16 diverse algorithms across four major currency pairs: EUR/USD, GBP/USD, USD/CHF, and USD/JPY.
These bots use this strategy alongside dozens of others to maximize profit and minimize risk.
Each pair has 3-4 bots designed to trade for long-term gains, targeting 200-350 pips.
The multi-layered diversification ensures that even in tough market conditions, your investments are protected.
And the best part? I’m offering this EA portfolio for completely FREE.
Curious? Check it out here: my trading bots portfolio.
Final Thoughts
Combining Bollinger Bands with the Klinger Oscillator is a game-changer for spotting institutional activity.
It gives you a powerful edge in the market.
But remember, having the right tools is only part of the equation.
You also need a reliable broker to execute your trades efficiently.
I highly recommend checking out the best Forex brokers I’ve tested. They offer tight spreads and excellent support, which can significantly enhance your trading experience.
Head over to Most Trusted Forex Brokers and find one that suits your needs.
Happy trading! 🚀