Last Updated on February 24, 2025 by Arif Chowdhury
Are you tired of taking losses in your Forex trades?
Do you feel overwhelmed by all the indicators out there?
You’re not alone.
Many traders struggle to find reliable strategies that actually work.
As a seasoned Forex trader since 2015, I’ve explored both fundamental and technical analysis, and let me tell you, simplicity often wins.
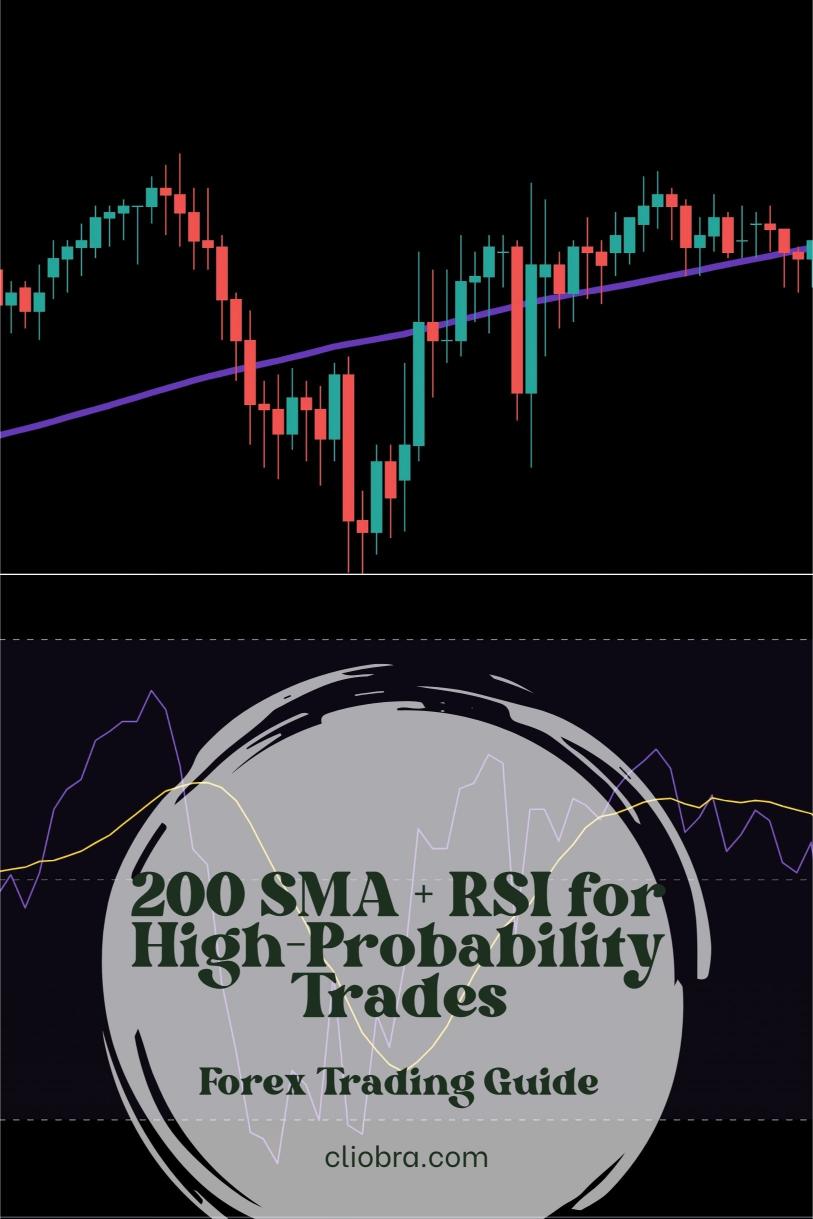
Today, I’m diving into a powerful combination: the 200 Simple Moving Average (SMA) and the Relative Strength Index (RSI).
This dynamic duo has been a game changer for me, and I believe it can help you too.
Understanding the 200 SMA
The 200 SMA is a trend-following indicator.
Here’s why it’s crucial:
- Identifies the Trend: A price above the 200 SMA indicates a bullish trend, while a price below indicates a bearish trend.
- Smooths Out Price Action: This moving average smooths out the noise, helping you focus on the overall trend.
The Power of RSI
On the flip side, we have the RSI:
- Momentum Indicator: The RSI ranges from 0 to 100 and helps identify overbought or oversold conditions.
- Classic Levels: An RSI above 70 typically indicates overbought conditions, while below 30 indicates oversold.
Combining these two gives you a high-probability trading setup.
How to Combine Them
Let’s break it down into actionable steps.
- Identify the Trend with the 200 SMA:
- If the price is above the 200 SMA, look for buy signals.
- If the price is below, focus on sell signals.
- Confirm with the RSI:
- For buying, wait until the RSI dips below 30 and then crosses back above it.
- For selling, look for the RSI to rise above 70 and then drop back below.
- Enter the Trade:
- Buy when both conditions are met in a bullish trend.
- Sell when both conditions are met in a bearish trend.
Why This Works
Statistically, strategies combining trend and momentum indicators yield better results.
For instance, studies show that using a 200 SMA in conjunction with other indicators can improve your win rate by as much as 20%.
And guess what?
This approach minimizes the risk of false signals since you’re confirming the trend with momentum.
My Trading Bots and Strategy
Here’s where it gets exciting.
I’ve developed a portfolio of 16 sophisticated trading bots that utilize the 200 SMA + RSI strategy among others.
These bots are diversified across key currency pairs like EUR/USD, GBP/USD, USD/CHF, and USD/JPY.
Why is this important?
- Risk Mitigation: Each bot is designed to minimize correlated losses.
- Long-Term Performance: They focus on capturing 200-350 pips, making them reliable for long-term gains.
- Backtested Success: My bots have been backtested for 20 years and perform excellently, even under tough market conditions.
And the best part?
I’m offering this entire EA portfolio for completely FREE.
If you’re ready to elevate your trading game, check out my trading bots portfolio.
Best Practices for Using 200 SMA + RSI
- Stay Patient: Wait for clear signals. If the RSI isn’t confirming the trend, don’t rush in.
- Use Multiple Time Frames: Confirm your analysis on higher time frames for added confidence.
- Set Stop Losses: Always protect your capital. Even the best strategies can have losing trades.
Choosing the Right Broker
Before you dive in, make sure you choose a reliable broker.
You want one that offers tight spreads, quick execution, and excellent support.
I’ve tested several brokers and can confidently recommend some of the best.
Check out my list of top brokers here: Most Trusted Forex Brokers.
Final Thoughts
Combining the 200 SMA and RSI is a straightforward yet effective strategy that can enhance your trading performance.
Remember, patience and discipline are key.
And if you’re ready to automate your success, don’t forget to explore my 16 trading bots portfolio.
Let’s make those high-probability trades together!
