Last Updated on February 23, 2025 by Arif Chowdhury
Are you struggling to find reliable entry and exit points in your swing trading?
Maybe you’ve felt the frustration of missing out on profits or watching your trades go south.
Today, I want to share a powerful strategy that’s been a game changer for me: combining RSI divergence with the 200 EMA.
This combo can help you make informed trading decisions and improve your profitability.
Let’s dive in!
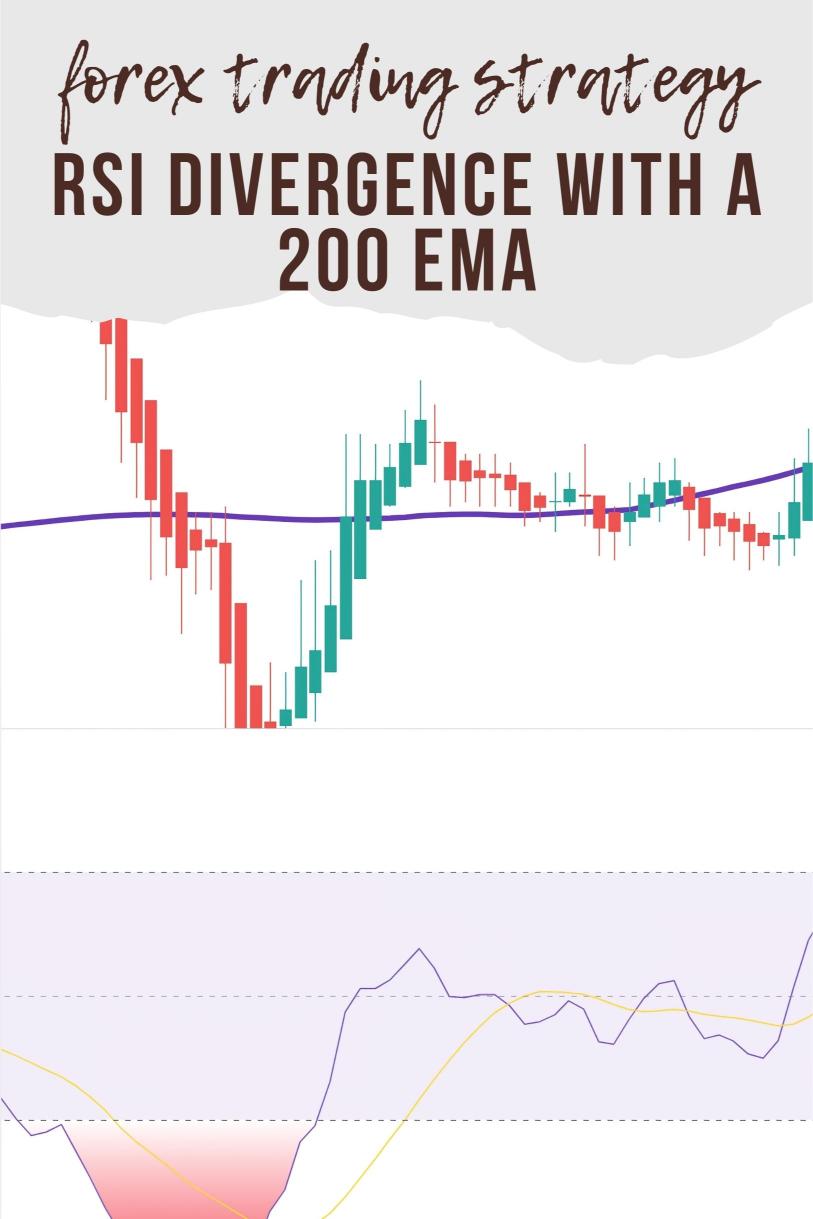
Understanding RSI Divergence
First off, what is RSI divergence?
The Relative Strength Index (RSI) is a momentum oscillator that measures the speed and change of price movements.
It ranges from 0 to 100, and typically, levels above 70 indicate overbought conditions, while levels below 30 suggest oversold conditions.
Divergence occurs when the price of an asset moves in the opposite direction to the RSI.
Here’s why it matters:
- Bullish Divergence: Price makes lower lows, but the RSI makes higher lows. This signals a potential trend reversal to the upside.
- Bearish Divergence: Price makes higher highs, but the RSI makes lower highs. This indicates a possible trend reversal to the downside.
Statistically speaking, many traders find that divergence can predict reversals with an accuracy of around 70-80%.
That’s serious potential!
The Role of the 200 EMA
Now, let’s talk about the 200 EMA (Exponential Moving Average).
This is a trend-following indicator that smooths out price data to identify the direction of the trend.
Why is it crucial?
- Support and Resistance: The 200 EMA often acts as a dynamic support or resistance level.
- Trend Confirmation: When the price is above the 200 EMA, it’s generally considered an uptrend, and below it, a downtrend.
Combining the 200 EMA with RSI divergence gives you a double confirmation, enhancing your chances of a successful trade.
How to Combine Them
Now, let’s get to the juicy part—how to effectively combine these tools for your swing trades.
- Identify the Trend:
- Use the 200 EMA to determine the overall trend.
- If the price is above the 200 EMA, look for bullish divergence.
- If it’s below, look for bearish divergence.
- Spot Divergence:
- Check the RSI for divergence signals.
- Look for those higher lows in a downtrend or lower highs in an uptrend.
- Confirm Entry:
- Wait for the price to break the 200 EMA in the direction of your divergence signal.
- This adds a layer of confirmation to your trade.
- Set Your Stop Loss and Take Profit:
- Set a stop loss just below the recent swing low (for buys) or above the swing high (for sells).
- Aim for a risk-to-reward ratio of at least 1:2.
Why This Strategy Works
The combination of RSI divergence and the 200 EMA allows you to:
- Reduce Risk: By confirming trades with both indicators, you minimize the chances of false signals.
- Maximize Returns: This strategy can lead to more profitable trades, especially if you catch reversals early.
As a seasoned Forex trader since 2015, I’ve seen firsthand how effective this strategy can be.
And if you’re looking to automate your trading, I’ve developed a portfolio of 16 trading EAs that incorporate this strategy among others.
These bots focus on major currency pairs like EUR/USD, GBP/USD, USD/CHF, and USD/JPY.
Each bot is designed to trade on H4 charts, aiming for long-term profits of 200-350 pips.
Plus, I’m offering this EA portfolio for FREE!
You can check it out here: Explore my trading bots.
Final Thoughts
Before you jump into trading, remember a few key points:
- Stay disciplined.
- Don’t interfere with your EAs once they’re set up; let them run 24/7.
- Always be aware of market risks.
To find reliable brokers to execute your trades, check out my tested recommendations: Best Forex Brokers.
Combining RSI divergence with the 200 EMA isn’t just a theory.
It’s a strategy that can lead to consistent profits if done right.
So, grab your charts, apply this strategy, and watch your trading experience transform!