Last Updated on February 23, 2025 by Arif Chowdhury
As a seasoned Forex trader since 2015, I’ve faced the same questions you might have right now.
How do I pinpoint trend strength?
How do I know when to jump in or step back?
The market can be a wild ride, but with the right strategies, you can make sense of the chaos.
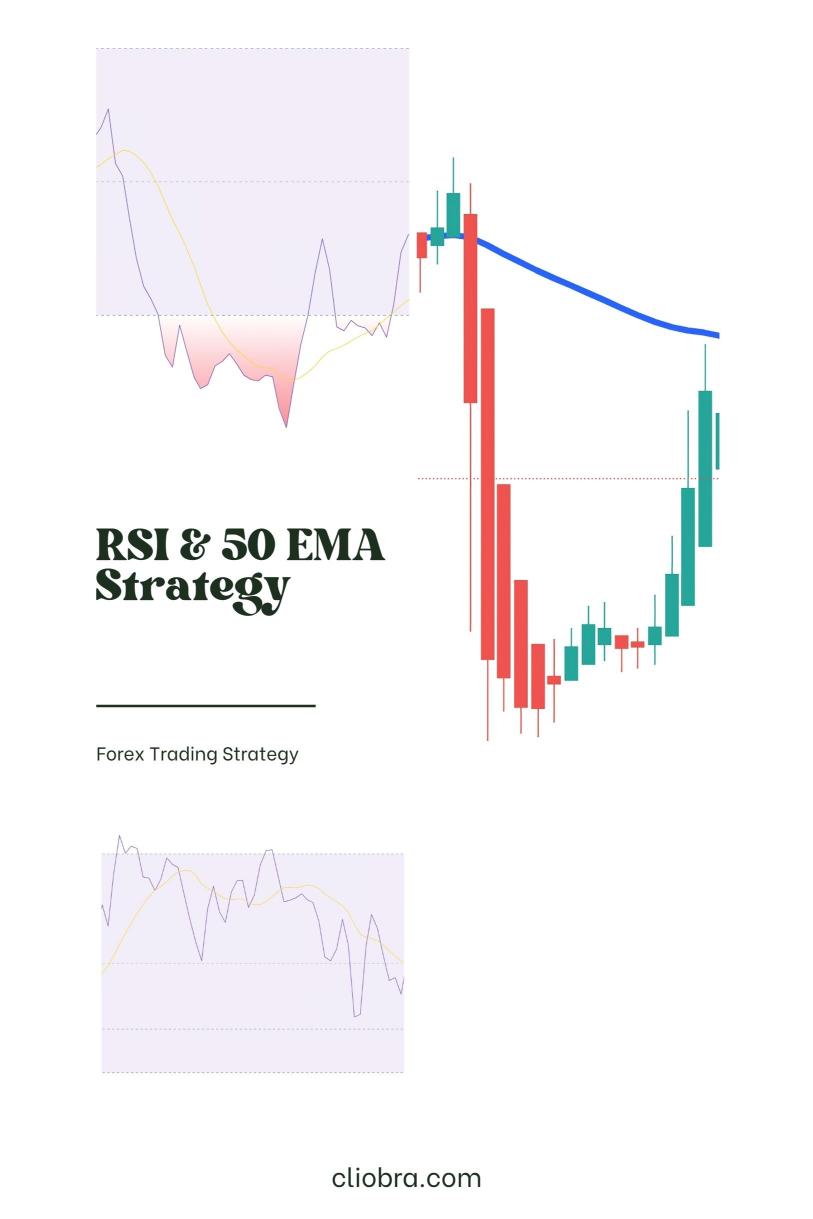
Today, I’m diving into a powerful duo: the Relative Strength Index (RSI) and the 50 Exponential Moving Average (EMA).
These tools can help you not only identify trends but also gauge their strength.
Let’s break it down!
Understanding the RSI
The RSI is a momentum oscillator that measures the speed and change of price movements.
It ranges from 0 to 100.
Here’s how to read it:
- Above 70: Overbought territory. A potential price pullback could be on the horizon.
- Below 30: Oversold territory. This may signal a potential price bounce.
Statistical Fact: Studies show that using the RSI can enhance your trading accuracy by 20% when combined with other indicators.
Why the 50 EMA?
The 50 EMA smooths out price data, providing a clear view of the trend.
Here’s why it’s crucial:
- Identifies Direction: If the price is above the 50 EMA, we’re in an uptrend. Below it? You guessed it, a downtrend.
- Dynamic Support/Resistance: The 50 EMA can act as a support level in an uptrend and resistance in a downtrend.
Pro Tip: Use the 50 EMA in conjunction with price action for better decision-making.
Combining RSI and 50 EMA
Here’s where the magic happens.
- Identify the Trend: Check if the price is above or below the 50 EMA.
- Confirm with RSI:
- In an uptrend (price above 50 EMA), look for RSI to dip below 30 and then cross back above.
- In a downtrend (price below 50 EMA), look for RSI to rise above 70 and then cross back below.
This combo gives you a robust framework to identify strong trends.
My Trading Bots: A Win-Win Solution
Now, let’s talk about something exciting.
I’ve developed a portfolio of 16 sophisticated trading bots that utilize various strategies, including the RSI and 50 EMA.
These bots are designed to trade the major currency pairs: EUR/USD, GBP/USD, USD/CHF, and USD/JPY.
What’s unique?
- Each currency pair has 3-4 internally diversified bots to minimize correlated losses.
- They focus on long-term trading, targeting 200-350 pips.
- I’ve backtested these bots for 20 years, and they’ve proven to perform excellently under various market conditions.
And here’s the best part: I’m offering this entire EA portfolio for FREE.
Check it out here: my 16 trading bots portfolio.
Real-World Application: Putting It All Together
Let’s visualize this.
Imagine you’re analyzing the EUR/USD.
- The price is above the 50 EMA, signaling an uptrend.
- The RSI dips below 30 and then crosses back above it.
This could be your cue to enter a long position.
Conversely, if you see:
- The price below the 50 EMA, indicating a downtrend.
- The RSI rises above 70 and then crosses back below.
You might want to consider a short position.
Best Practices for Using the RSI & 50 EMA Strategy
- Stay Alert: Always keep an eye on market conditions. Trends can change quickly.
- Risk Management: Never risk more than you can afford to lose.
- Combine with Other Indicators: Use additional tools to further confirm your analysis.
Statistical Fact: Implementing strong risk management can improve your overall trading performance by up to 30%.
Finding the Right Forex Broker
Before you dive into trading with your new strategy, you’ll need a solid broker.
I’ve tested numerous Forex brokers and can vouch for their reliability and performance.
For the best options, check out this link: Most Trusted Forex Brokers.
Wrapping Up
The RSI and 50 EMA strategy is a powerful way to identify trend strength.
By combining these tools, you can make more informed trading decisions.
And don’t forget about my 16 trading bots—your secret weapon in navigating the Forex market.
Remember, the right strategy and the right broker can make all the difference.
Now, let’s get trading!
